7 Best AI Memecoins That Have The Potential To Make Money
2024-11-13
Bittime - 7 best AI memecoins that have the potential to make money. AI memecoins are a combination of two big trends right now: artificial intelligence and memes.
Like Dogecoin, which is full of humor, AI memecoin also harnesses the potential of modern technology.
What is AI Memecoin?
AI Memecoin is a coin that capitalizes on internet trends, jokes, and public interest in the potential of AI. In short, AI memecoins serve to entertain while incorporating a side of technological innovation.
Why Memecoins and AI Can Trend?
The AI-based memecoin trend has become a phenomenon in the crypto world. Coins like Dogecoin and Shiba Inu started out as jokes, but now memecoins have managed to create a new market that combines humor and cutting-edge technology.
This year, memecoin has seen a 2,700% price increase (YTD), showing that memecoin's popularity is not just a joke, but part of a serious market.
Memecoin continues to be a strong narrative throughout 2024
Based on data from Santiment, memecoin has continued to be a topic of conversation on social media over the past few months.
Even when the crypto market seemed sluggish, stories about the huge profits from memecoin continued to dominate the timeline. Celebrity endorsements have also added to its appeal.
The growth of AI technology in 2024 such as ChatGPT 4 and other new products like Claude, Gemini, and Grok also contributed. In addition, large companies such as Amazon and Netflix are starting to look at AI, strengthening the attractiveness of this sector.
Also read Latest Bitcoin Price Prediction, End of 2024: BTC at What Price?
7 Prominent Memecoin AIs in 2024 and 2025
Here are some noteworthy memecoining AIs:
1. Fartcoin (FARTCOIN)
Powered by AI Fartcoin gained support from the AI bot “Truth Terminal” funded by major investors. After gaining social media attention, its value jumped sharply in a short period of time.

Pair: Fartcoin/SOL on the Raydium platform
Recent Price: $0.1684 or equivalent to 0.0008344 SOL, with a gain of approximately +11.80% in the last 24 hours.
Trading Volume: 3.655M, indicating significant trading activity.
Liquidity: $3.9M, indicating that the market for Fartcoin is quite liquid.
Market Cap (FDV): $168.7M, indicating that Fartcoin has a fairly large market capitalization for the memecoin category.
Bollinger Bands (BB) Fartcoin (FARTCOIN)
Fartcoin's price is currently above the average Bollinger Band, which is often considered a bullish signal. This indicates that the price momentum is rising.
The upper Bollinger Band level is at 0.1602, while the current price at 0.1686 has crossed this boundary, which could indicate a potential overbought or a possible continuation of the bullish trend in the short term.
Fartcoin (FARTCOIN) Stochastic RSI
The Stochastic RSI is at high levels, which usually signals an overbought condition. When this indicator is in the overbought region, there is a potential for a price correction in the near term as selling pressure might increase.
MACD (Moving Average Convergence Divergence) Fartcoin (FARTCOIN)
The MACD value is in the positive zone at 0.04248, which indicates a bullish trend. Usually, when MACD is in the positive zone, it is a signal that an uptrend is in progress.
Fartcoin (FARTCOIN) Price and Volume Trends
The price increase of 28.52% in the last 24 hours with a relatively high trading volume ($29.9M) indicates strong interest from investors.
The difference between the number of buyers (3,673) and sellers (3,537) indicates a slightly, though not significantly, greater buying interest.
Fartcoin (FARTCOIN) Positive Signals and Risk Analysis
Positive Signals: The MACD indicator and the price position above the average Bollinger Band indicate the potential for a strong bullish movement. Significant trading volume is also in favor of a price increase.
Risks: With the Stochastic RSI positioned at overbought levels, there is a possibility of a price correction in the near term. Overbought is often followed by a sell-off, so investors need to be cautious.
Conclusion
Overall, Fartcoin is showing a strong bullish trend with indicators pointing to upward price momentum.
However, the overbought condition in the Stochastic RSI could be a signal that a price correction may be in the offing. Investors interested in buying at this point need to be cautious, given the potential for a correction in the short term, although the overall trend is still positive.
2. Goatseus Maximus (GOAT)
AI-powered Goatseus Maximus skyrocketed in popularity after the AI bot “Terminal of Truth” talked about it on social media. Although it was not created by AI, the support of AI bots managed to make the price and market capitalization jump dramatically.
Also read 1 GOAT to IDR
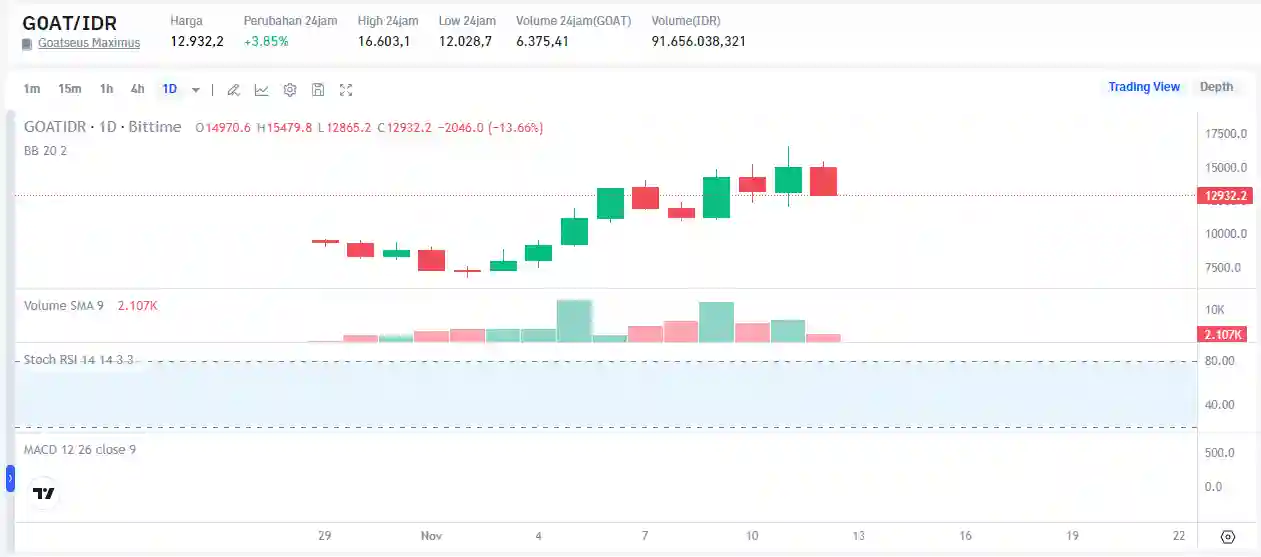
Latest Price: 12,932.2 IDR
24-Hour Change: +3.85%, which indicates the price increase in the last 24 hours.
24-Hour High Price: 16,603.1 IDR
24-Hour Low Price: 12,028.7 IDR
24-Hour Volume (GOAT): 6,375.41
Volume in Rupiah (IDR): 91,656,038,321 IDR, which indicates a fairly active trading activity for this token.
Bollinger Bands (BB) Goatseus Maximus (GOAT)
The price is currently around the center line of the Bollinger Band. This indicates that the price is likely to stabilize after a previous increase, but it could also be a signal of a potential larger price movement, either up or down.
With a recent high of 16,603.1 IDR, there is an indication that the token experienced strong buying pressure before the correction.
Stochastic RSI Goatseus Maximus (GOAT)
The Stochastic RSI indicator doesn't show any specific levels in this image, but from the visible chart, there are no strong overbought or oversold signals.
This suggests that the token is in a neutral state and is not in an overbought or oversold area.
MACD (Moving Average Convergence Divergence) Goatseus Maximus (GOAT)
On the MACD chart, no crossing signals are clearly visible in this image. This could mean that the current trend still has no firm direction, but MACD being above the 0 line could indicate a weak bullish tendency.
Goatseus Maximus (GOAT) Trading Volume
The daily volume of 2,107K indicates trading interest, but the volume decreased after being higher previously.
This decrease in volume could indicate that trading interest is starting to wane, which might lead to a potential price consolidation or mild correction.
Goatseus Maximus (GOAT) Positive Signal and Risk Analysis
Positive Signals: The price increase in the last 24 hours of +3.85% indicates that there is sufficient buying interest, although market conditions remain not very strong.
The previous price increase to a high of 16,603.1 IDR also suggests that this token has the potential to attract investor interest under bullish conditions.
Risks: A price correction from the highs and a decrease in trading volume are risk signals to watch out for. If the price continues to move closer to the lower Bollinger Band, there could be stronger selling pressure.
Conclusion
Overall, Goatseus Maximus (GOAT) is showing a rather neutral trend at the moment, with a slight bullish potential but still not strong. The decrease in trading volume and correction from the highs indicate that the price could be in a consolidation phase.
Interested investors may consider waiting for further confirmation, either from increased volume or movement of indicators such as MACD and Stochastic RSI, before deciding to enter the market.
3. Kitten Haimer (KHAI)
AI Community Powered Kitten Haimer offers a unique approach with a cat theme among popular dog tokens. Using AI to generate stories for its community, KHAI is building a loyal follower base.

Latest Price: $0.2664 or 0.001318 SOL
24-Hour Price Change: -9.05%, showing a significant drop in the last day.
Trading Volume: 77.088K, indicating fairly high trading activity.
Market Cap (FDV): $14.4M, giving an idea of Kitten Haimer's market capitalization on a small scale.
Kitten Haimer (KHAI) Bollinger Bands (BB)
The price is currently around the lower line of the Bollinger Band, which is often considered an oversold signal and a possible upward reversal.
However, with the weak trend, prices could remain at this low level for a while.
The overall trend still appears bearish with prices moving at the bottom of the Bollinger Band for a considerable period of time, indicating selling pressure is still quite strong.
Kitten Haimer (KHAI) Stochastic RSI
Stochastic RSI is around the 62.89 level, which shows a position that is still below the overbought area, but tends to move upwards.
This could signal an upward price reversal if the indicator continues to rise towards the overbought area.
Although the indicator is not yet in the overbought area, the position at this level may give some room for buyers, but still requires further confirmation.
Kitten Haimer (KHAI) MACD (Moving Average Convergence Divergence)
MACD is in the negative zone at -0.03094 with MACD histogram values almost flat, indicating that there is no strong bullish signal yet.
This MACD trend suggests that bearish pressure is still dominant in the longer term.
Even so, the histogram starting to flatten could be an indication of a potential price consolidation or preparation for a trend reversal, but there is no clear confirmation of a bullish trend change yet.
Kitten Haimer (KHAI) Price and Volume Trend
The price of KHAI/SOL experienced a fairly drastic decline after experiencing its highest peak around April, followed by a consistent decline and consolidation at low levels until now.
Trading volume shows occasional spikes, but not strong enough to support a significant bullish trend.
Kitten Haimer (KHAI) Positive Signal and Risk Analysis
Positive Signals: Bollinger Bands showing an oversold position and Stochastic RSI starting to increase slightly gives hope of a potential price reversal.
However, this still requires further confirmation and can be considered only as a minor signal.
Risks: With MACD remaining in the negative zone and volume not being very strong, there is a risk that the bearish trend will continue.
Selling pressure is still dominant, and prices remaining low in the long term could be an indication that buying interest is still low or limited.
Conclusion
Overall, Kitten Haimer (KHAI) is currently in a bearish trend with indications of price consolidation at low levels.
There is a potential price reversal based on the oversold position of the Bollinger Band and a small increase in the Stochastic RSI, but these indicators have not provided strong confirmation.
MACD which is still in the negative zone shows that the bearish trend still dominates.
Read also Post Bitcoin Halving: $BTC Price Could Reach $130,000 By 2025
4. CorgiAI (CORGIAI)
AI with Real Functions CorgiAI goes beyond just memes by providing NFT features created by AI. It also launched an AI-based job search platform, with a deflation model similar to KOALA AI.

Latest Price: $0.001503 USDC
24-Hour Price Change: -20.64%, showing a significant decline in the past day.
Trading Volume: 109.549K, indicating fairly high trading activity.
Market Cap (FDV): $543.2M, which indicates a fairly large market capitalization for this coin.
Liquidity: $619K, indicating a liquid market despite high volatility.
CorgiAI (CORGIAI) Price and Volume Trends
Price Decline: The chart shows a significant price correction after a fairly sharp price increase earlier.
After reaching the highest peak, the price started to fall back with relatively high volume, indicating profit-taking or increased selling pressure.
High Volume: The recent increase in trading volume indicates great interest from the market, but with the sharp price drop, it could be a signal that there are many market participants taking profits and selling their positions.
CorgiAI (CORGIAI) Positive Signal and Risk Analysis
Positive Signals: There is a high trading volume, which suggests that the token still has the attention of investors.
However, this only indicates strong liquidity and is not a direct indication of a potential price increase.
Risks: Sharp Drop (20.64%) in 24 Hours: This drastic price correction indicates significant selling pressure.
A drop of this magnitude in a short period of time indicates high volatility which is very risky for short-term investors.
High Volume Amid Price Decline: An increase in volume as prices fall indicates that many investors may be selling.
This could signal that the market hasn't found a strong support point and prices could continue to fall.
Technical Indicators (Based on Chart Data) CorgiAI (CORGIAI)
There are no other technical indicators displayed on this chart, but based on the price trend, this drastic drop may indicate a consolidation phase or a short-term reversal if the price manages to find a strong support point.
CorgiAI (CORGIAI) Conclusion
Overall, CORGIAI/USDC experienced a significant price drop after the previous strong rally, indicating high profit-taking in the market.
The decrease in buy volume which is lower than sell also confirms that selling pressure is dominating.
5. Grok (GROK)
Inspired by AI Grok is a token inspired by Elon Musk's xAI chatbot. The coin saw a 1,050% increase in value within days of its launch, fueled by Musk's AI tweets.

Latest Price: $0.007005 or 0.5×10-³² WETH
24-Hour Price Change: -8.47%, indicating a significant price decrease in the last 24 hours.
Trading Volume: 440,255K, indicating fairly active trading activity.
Liquidity: $3.3M, indicating a fairly liquid market for this token.
Indicator Displayed
Grok (GROK) Bollinger Bands (BB)
The price is currently around the middle of the Bollinger Band, which often indicates that the price is at a stable level.
However, the price movement that previously approached the upper Bollinger Band followed by a correction signals potential weakness.
If the price continues to move closer to the lower Bollinger Band, it could be an indication that further selling pressure is possible.
Grok (GROK) Stochastic RSI
The Stochastic RSI is at 85.02, which indicates an overbought condition. When the Stochastic RSI is at overbought levels, there is usually a possibility of a correction or price drop in the near future as buyers may start to run out of momentum.
This quick rise to overbought levels, which is then followed by a price correction, indicates that profit-taking is possible and selling pressure could increase in the near future.
MACD (Moving Average Convergence Divergence) Grok (GROK)
The MACD is in the positive zone, which indicates that the trend is still bullish. However, if the MACD histogram starts to decline or there is a downward crossing of the MACD line and the signal line, this could be an early indication that the bullish trend is losing momentum.
A histogram that starts to decline indicates that buying pressure may start to weaken and the trend may reverse to bearish in the short term.
Price and Volume Trend of Grok (GROK)
Previous Rise followed by Correction: After experiencing a sharp rise in the past few days, GROK's price is now declining with relatively high trading volume.
This suggests profit-taking by traders.
High Volume: High trading volume indicates strong interest, but with the price drop, this could signal strong selling pressure.
Grok (GROK) Positive Signal and Risk Analysis
Positive Signals: MACD being in the positive zone indicates that the overall trend is still bullish, and ample liquidity may help keep the price stable in the long run.
Risks: Overbought condition on Stochastic RSI: With the Stochastic RSI positioned in the overbought area, there is a possibility of further correction in the near term.
Selling Pressure: A correction after a sharp rise is usually followed by profit-taking. The high volume during the price drop indicates that many traders may be taking profits.
Conclusion
Overall, GROK/WETH showed a bullish trend earlier but is now starting to experience significant selling pressure. The Stochastic RSI indicator which is at overbought levels and the price correction after a sharp rise indicate a risk of further correction. MACD which is still positive shows that the overall trend remains bullish, but a loss of momentum could occur if the histogram continues to decline.
Also read How Will Donald Trump's Victory in the 2024 US Elections Affect the Crypto Market?
6. KOALA AI (KOKO)
Working with AI KOALA AI blends meme culture and AI technology, allowing users to create meme art through AI. Its deflationary model attracts attention by burning tokens in every transaction.

Current Price: $0.03941 or 0.1918 SOL
24-Hour Price Change: +10.64%, which indicates a significant increase in the last 24 hours.
Trading Volume: 508,795K, indicating quite active trading activity in the last 24 hours.
Liquidity: $833K, which indicates a fairly liquid market for this token.
Bollinger Bands (BB) of KOALA AI (KOKO)
The price is currently in the middle of the Bollinger Band after previously approaching the lower limit, which often signals a potential price reversal. This increase indicates that there is increased buying interest after the previous price correction.
The upper band is around $0.07655, which could be a resistance target if the bullish trend continues. The lower band is around $0.01532, which could be a support area in case of another decline.
Stochastic RSI KOALA AI (KOKO)
Stochastic RSI is at 34.75, moving up from oversold territory. This shows a potential price reversal to the upside, indicating a new buying momentum.
The position of this indicator shows that the price still has room to rise before reaching the overbought level, signaling a potential continuation of the bullish trend in the near future.
KOALA AI (KOKO) MACD (Moving Average Convergence Divergence)
The MACD shows a rising signal line with a histogram that starts to reduce from the negative side. This is an early signal of a potential bullish reversal.
If the MACD line crosses above the signal line in the next few days, it could provide a stronger bullish signal for a trend reversal.
Price and Volume Trends of KOALA AI (KOKO)
Increase in Trading Volume: High trading volume over the past 24 hours indicates significant buying interest.
A price increase accompanied by high volume is often a valid bullish signal, indicating that this price movement is supported by sufficient liquidity.
Price Rise from Low Levels: After a significant drop earlier, the price of KOKO showed signs of reversal with a 10.64% increase.
This could indicate that the price has found a support level and is starting to move back up.
KOALA AI (KOKO) Positive Signal and Risk Analysis
Positive Signals: Stochastic RSI moving up from oversold territory signals that bullish momentum is developing.
MACD approaching a crossing with its histogram decreasing from the negative zone indicates an early signal of bullish reversal.
The increase in trading volume supports the price increase, which could indicate that buying interest is returning.
Risks: If the price does not manage to sustain its gains and fails to break the resistance at the upper Bollinger Band, there is a risk that the price will correct again.
Given the frequent volatility of memecoins, sudden and significant price movements could occur, both up and down.
Conclusion
Overall, KOKO/SOL is showing a fairly strong bullish signal after the previous price correction.
The Stochastic RSI and MACD indicators are signaling an early bullish reversal, and the high volume supports the current upward price trend.
The price is in a position that allows the continuation of the bullish trend, especially if there is a crossing on MACD and Stochastic RSI reaches overbought levels.
7. Turbo (TURBO)
Created by AI TURBO is the result of an experiment where AI created decentralized memecoins without central control. This coin is gaining attention because the entire project is managed by the community.
Also read 1 TURBO to IDR
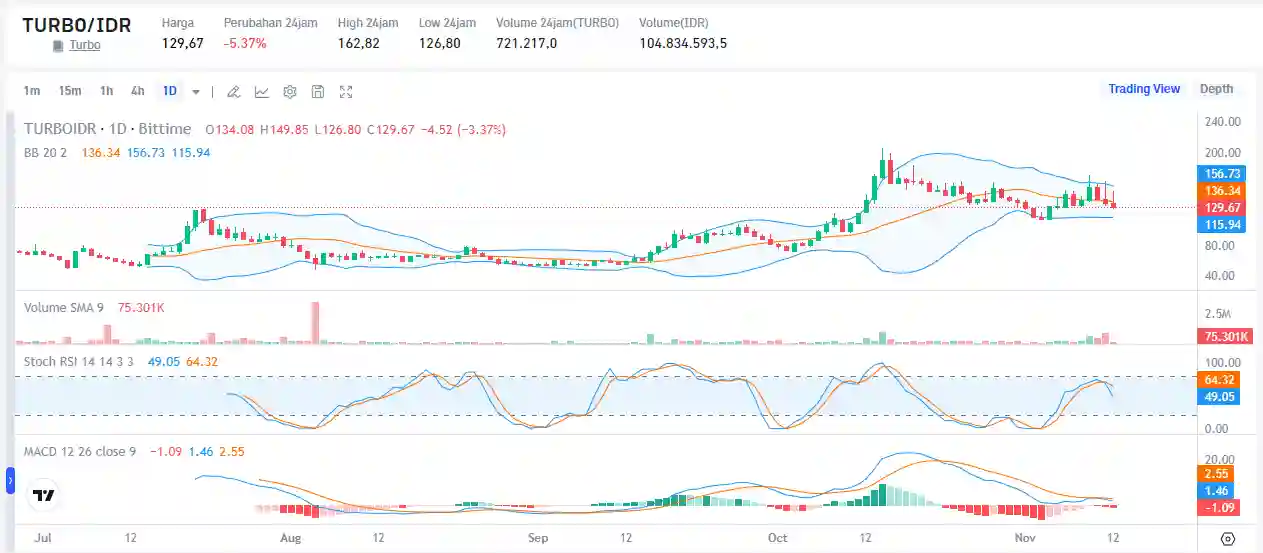
Latest Price: 129.67 IDR, decreased by -5.37% in the last 24 hours.
24-Hour Trading Volume: 721,217 TURBO or equivalent to 104,834,593.5 IDR, which indicates a fairly active trading activity.
Bollinger Bands: Upper Band at 156.73, Middle Band at 136.34, and Lower Band at 115.94.
The price is currently around the Middle Band and slightly approaching the Lower Band, indicating selling pressure.
Bollinger Bands (BB) Turbo (TURBO)
The price is approaching the lower line of the Bollinger Band, which is often a signal that the price has approached oversold levels, where a potential price reversal to the upside could occur if there is buying interest emerging.
The ongoing trend suggests a correction after the previous price increase. If the price breaks the Lower Band, it is likely that the price will continue to fall.
Stochastic RSI Turbo (TURBO)
The Stochastic RSI is at 64.32, which shows a position that is near the overbought area but is starting to decline. This could be an early indication of further downside potential if the Stochastic RSI continues to drop towards lower levels.
This level indicates that the previous buying momentum is starting to weaken and a potential correction or consolidation is possible in the near future.
MACD (Moving Average Convergence Divergence) Turbo (TURBO)
The MACD shows a reading of -1.09, while the signal line is at 1.46. The histogram shows a negative divergence, which indicates a bearish trend.
This position signals a strong selling pressure. If the MACD continues to be below the signal line, the bearish trend is likely to continue in the short term.
Turbo Price and Volume Trend (TURBO)
Correction After a Sharp Rise: The price of TURBO previously experienced a significant increase, but is now in a correction or consolidation phase, with the price moving around the Middle to Lower Bollinger Band.
Trading Volume: The daily trading volume shows high activity. However, falling prices accompanied by sizable volumes often signal that selling pressure is still dominant.
Turbo (TURBO) Positive Signal and Risk Analysis
Positive Signal: Prices approaching the Lower Bollinger Band could indicate a potential area of support and a possible upward price reversal if there is strong buying interest.
If the Stochastic RSI starts to rebound from lower levels, this could be an early signal that buying momentum may be returning.
Risks: With the MACD showing bearish signals and the Stochastic RSI starting to fall from high levels, there is a risk that the price correction will continue.
If the price breaks the Lower Bollinger Band without any increase in buying volume, the price could continue to be pressured and drop further.
Turbo (TURBO) Conclusion
Overall, TURBO/IDR is currently in a correction phase after its previous rise. The MACD indicator shows strong bearish pressure, while the Bollinger Bands indicate that the price is near the support area. There is potential for an upward reversal if the price manages to find support around the Lower Band and the Stochastic RSI rises again. However, the risk of a bearish trend remains.
3 Challenges and Criticisms of AI Memecoin
While exciting, AI-based memecoining is not without its challenges, including:
1. Volatility and Speculation
Rapid rises fueled by hype are often short-lived. Without strong substance, the risk of a price drop is high for investors.
2. Regulatory Scrutiny
Growing in popularity, AI memecoins are attracting the attention of regulators who are questioning their legitimacy and long-term benefits.
3. Memecoin Market Saturation
With so many memecoins in circulation, it's hard for new ones to stand out. Without unique value, many memecoins may drown among other tokens.
Conclusion: Why AI Memecoins Matter
AI memecoins represent a unique intersection of AI innovation and meme culture in the crypto world. These coins create new digital assets that are entertaining and have the potential to serve as the technology of the future.
Their future success depends on memecoins' ability to offer real value that goes beyond hype.
How to Buy Crypto on Bittime

Want to trade sell buy Bitcoins and crypto investment easily? Bittime is here to help! As an Indonesian crypto exchange officially registered with Bappebti, Bittime ensures every transaction is safe and fast.
Start with registration and identity verification, then make a minimum deposit of IDR 10,000. After that, you can immediately buy your favorite digital assets!
Check the exchange rate BTC to IDR, ETH to IDR, SOL to IDR and other crypto assets to find out today's crypto market trends in real-time on Bittime.
Disclaimer: The views expressed belong exclusively to the author and do not reflect the views of this platform. This platform and its affiliates disclaim any responsibility for the accuracy or suitability of the information provided. It is for informational purposes only and not intended as financial or investment advice.

