Act I Price Analysis: The AI Prophecy ($ACT), Any Bullish Rally Signals?
2024-11-16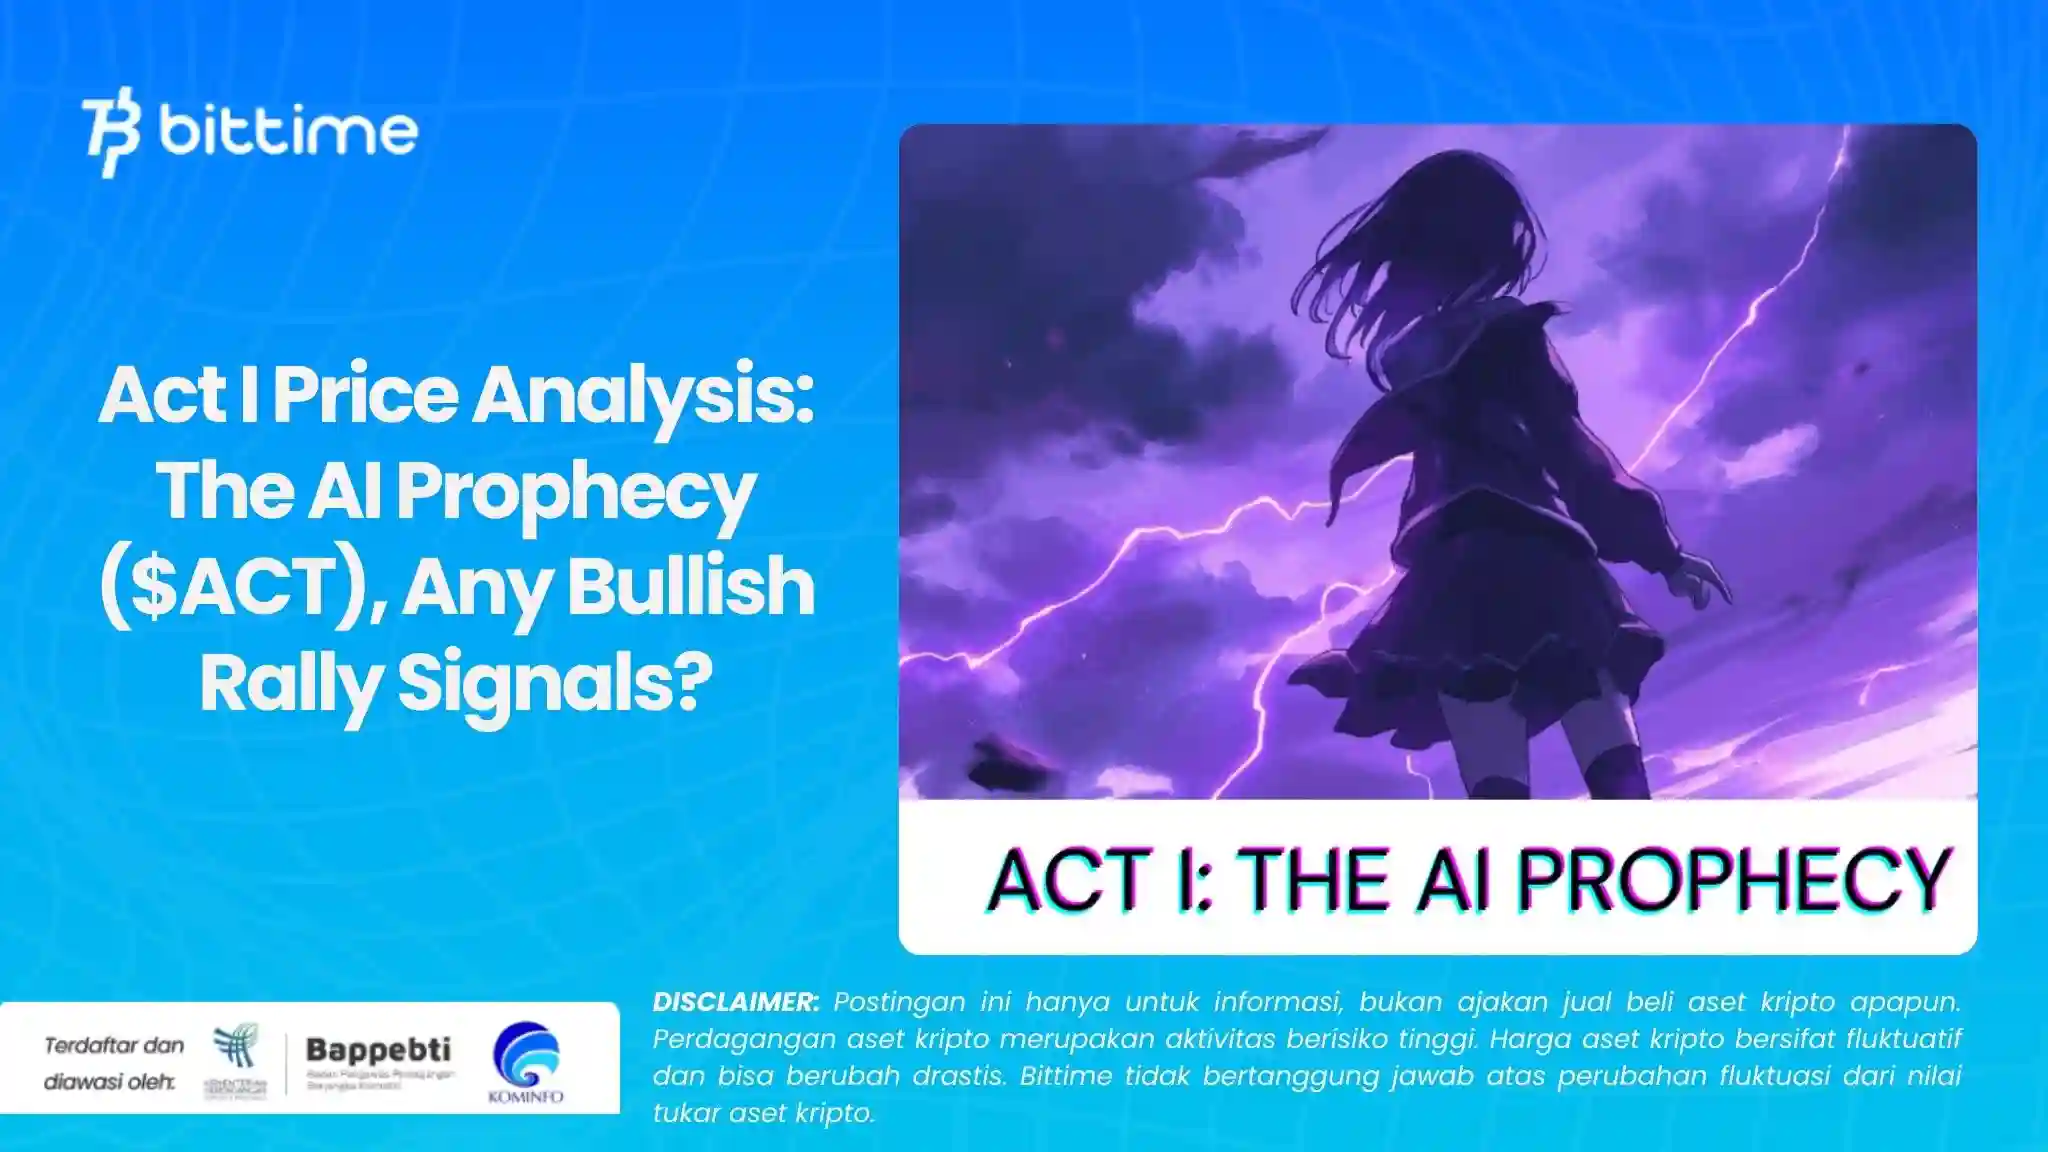
Bittime - Act I Price Analysis : The AI Prophecy ($ACT), Any bullish rally signals? In the cryptocurrency world, rapid price fluctuations often present interesting investment opportunities.
$ACT Token on the Rise
One token that has recently been in the spotlight is Act I: The AI Prophecy ($ACT). Technical charts suggest a potential bullish rally after the token successfully bounced off a key support level.
This article will explore the technical analysis of the $ACT price chart, identify important levels, and explore possible future moves.
Also read What is Act I The AI Prophecy (ACT) Token and Why is its price rising?
Technical Analysis of Act I Price: The AI Prophecy ($ACT)
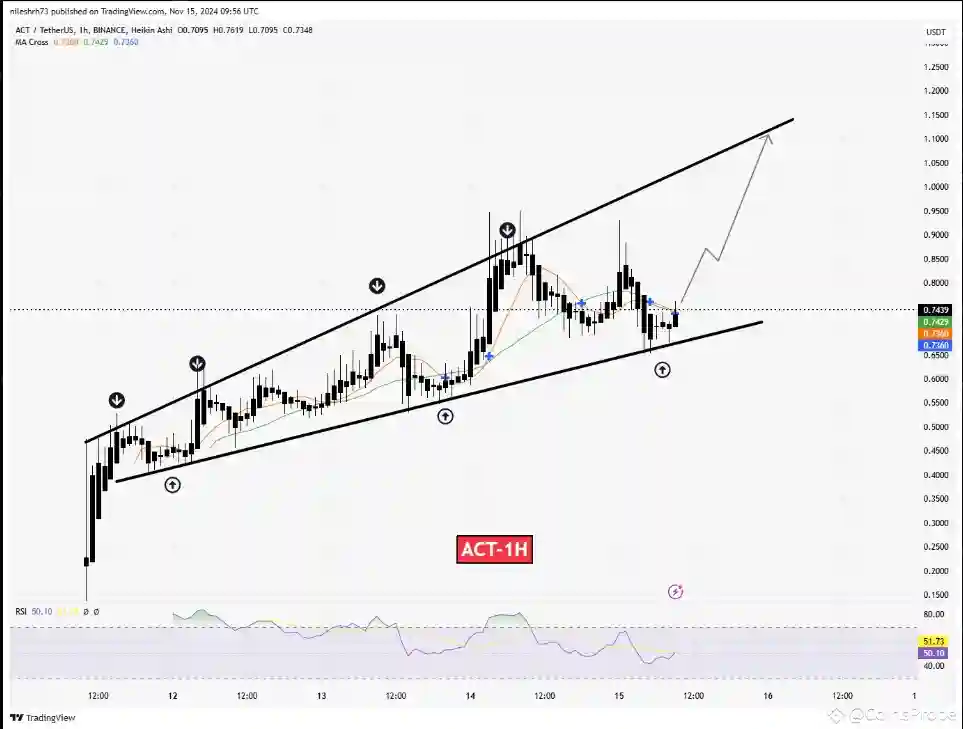
Sumber: CoinsProbe
1. Bounce from Support Level
Currently, $ACT is trading around $0.75 (IDR11,775), which is a strong support area in the $0.74-$0.75 (IDR11, 618-IDR11,775) zone. Some of the key technical indicators supporting the bullish outlook are:
Higher Lows
The higher lows pattern on the 1-hour chart indicates accumulated buying, usually a solid bullish signal.
Moving Average Cross
A moving average cross around $0.736 (IDR11,535) indicates the beginning of a short-term bullish trend. As long as the price stays above this level, the upside potential is maintained.
Potential Targets
If the bullish momentum continues, the next resistance target is around $1.10 (IDR17,270), providing upside potential of up to 47% from current levels.
2. RSI and Market Momentum
The Relative Strength Index (RSI) indicator is at 51.75, close to the neutral zone.
This gives room for prices to rise before reaching overbought levels, allowing bulls to keep control of the market.
3. $ACT Price Movement Forecast
Key Support Levels
$0.6688 (IDR10.504) - this level must be maintained to avoid a bearish trend.
Bullish Targets
Major resistance at $1.10 (IDR17,270) is a short-term upside target.
However, crypto market volatility remains a challenge, so it is important to monitor this technical level closely.
Also read Act I Token Price Prediction: The AI Prophecy (ACT) 2024 and 2025
Is $ACT Bullish Rally on the Horizon?
Based on the technical indicators, the chances of a bullish rally for $ACT are quite strong.
However, investors need to be cautious of a potential short correction, especially if the price drops below critical support levels.
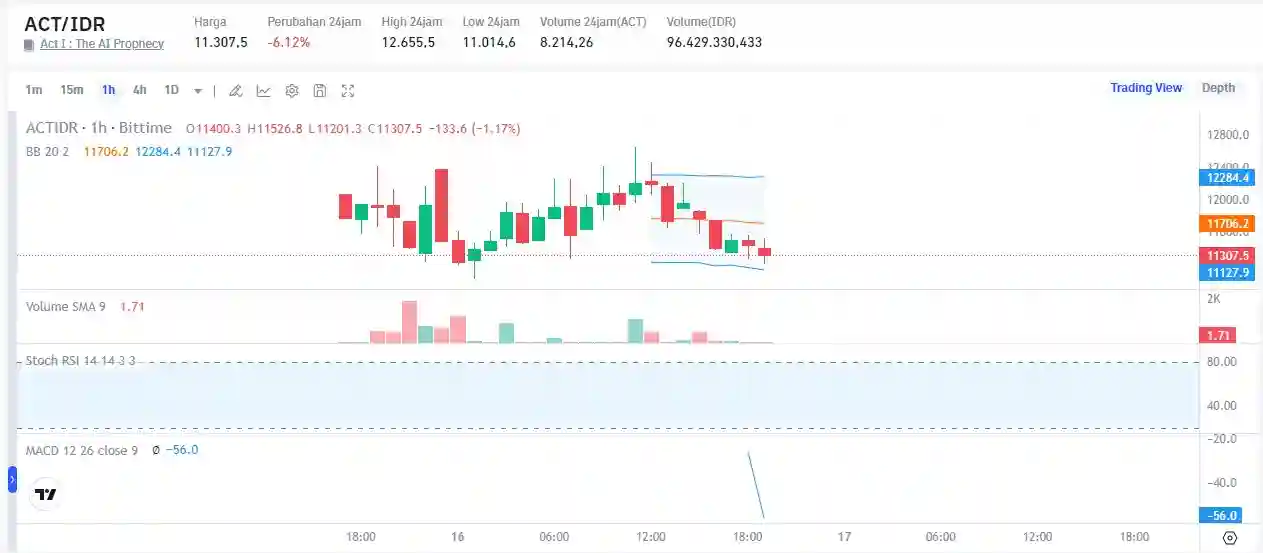
$ACT to IDR via Bittime Market
Monitoring the support zone at $0.6688 (IDR10,504) and resistance at $1.10 (IDR17,270) is crucial to determine the next move.
How to Buy Crypto on Bittime

Want to trade sell buy Bitcoins and crypto investment easily? Bittime is here to help! As an Indonesian crypto exchange officially registered with Bappebti, Bittime ensures every transaction is safe and fast.
Start with registration and identity verification, then make a minimum deposit of IDR 10,000. After that, you can immediately buy your favorite digital assets!
Check the exchange rate BTC to IDR, ETH to IDR, SOL to IDR and other crypto assets to find out today's crypto market trends in real-time on Bittime.
Disclaimer: The views expressed belong exclusively to the author and do not reflect the views of this platform. This platform and its affiliates disclaim any responsibility for the accuracy or suitability of the information provided. It is for informational purposes only and not intended as financial or investment advice.


