What Is Crypto RSI Heatmap? A Guide to Understanding Crypto Market Conditions
2024-11-08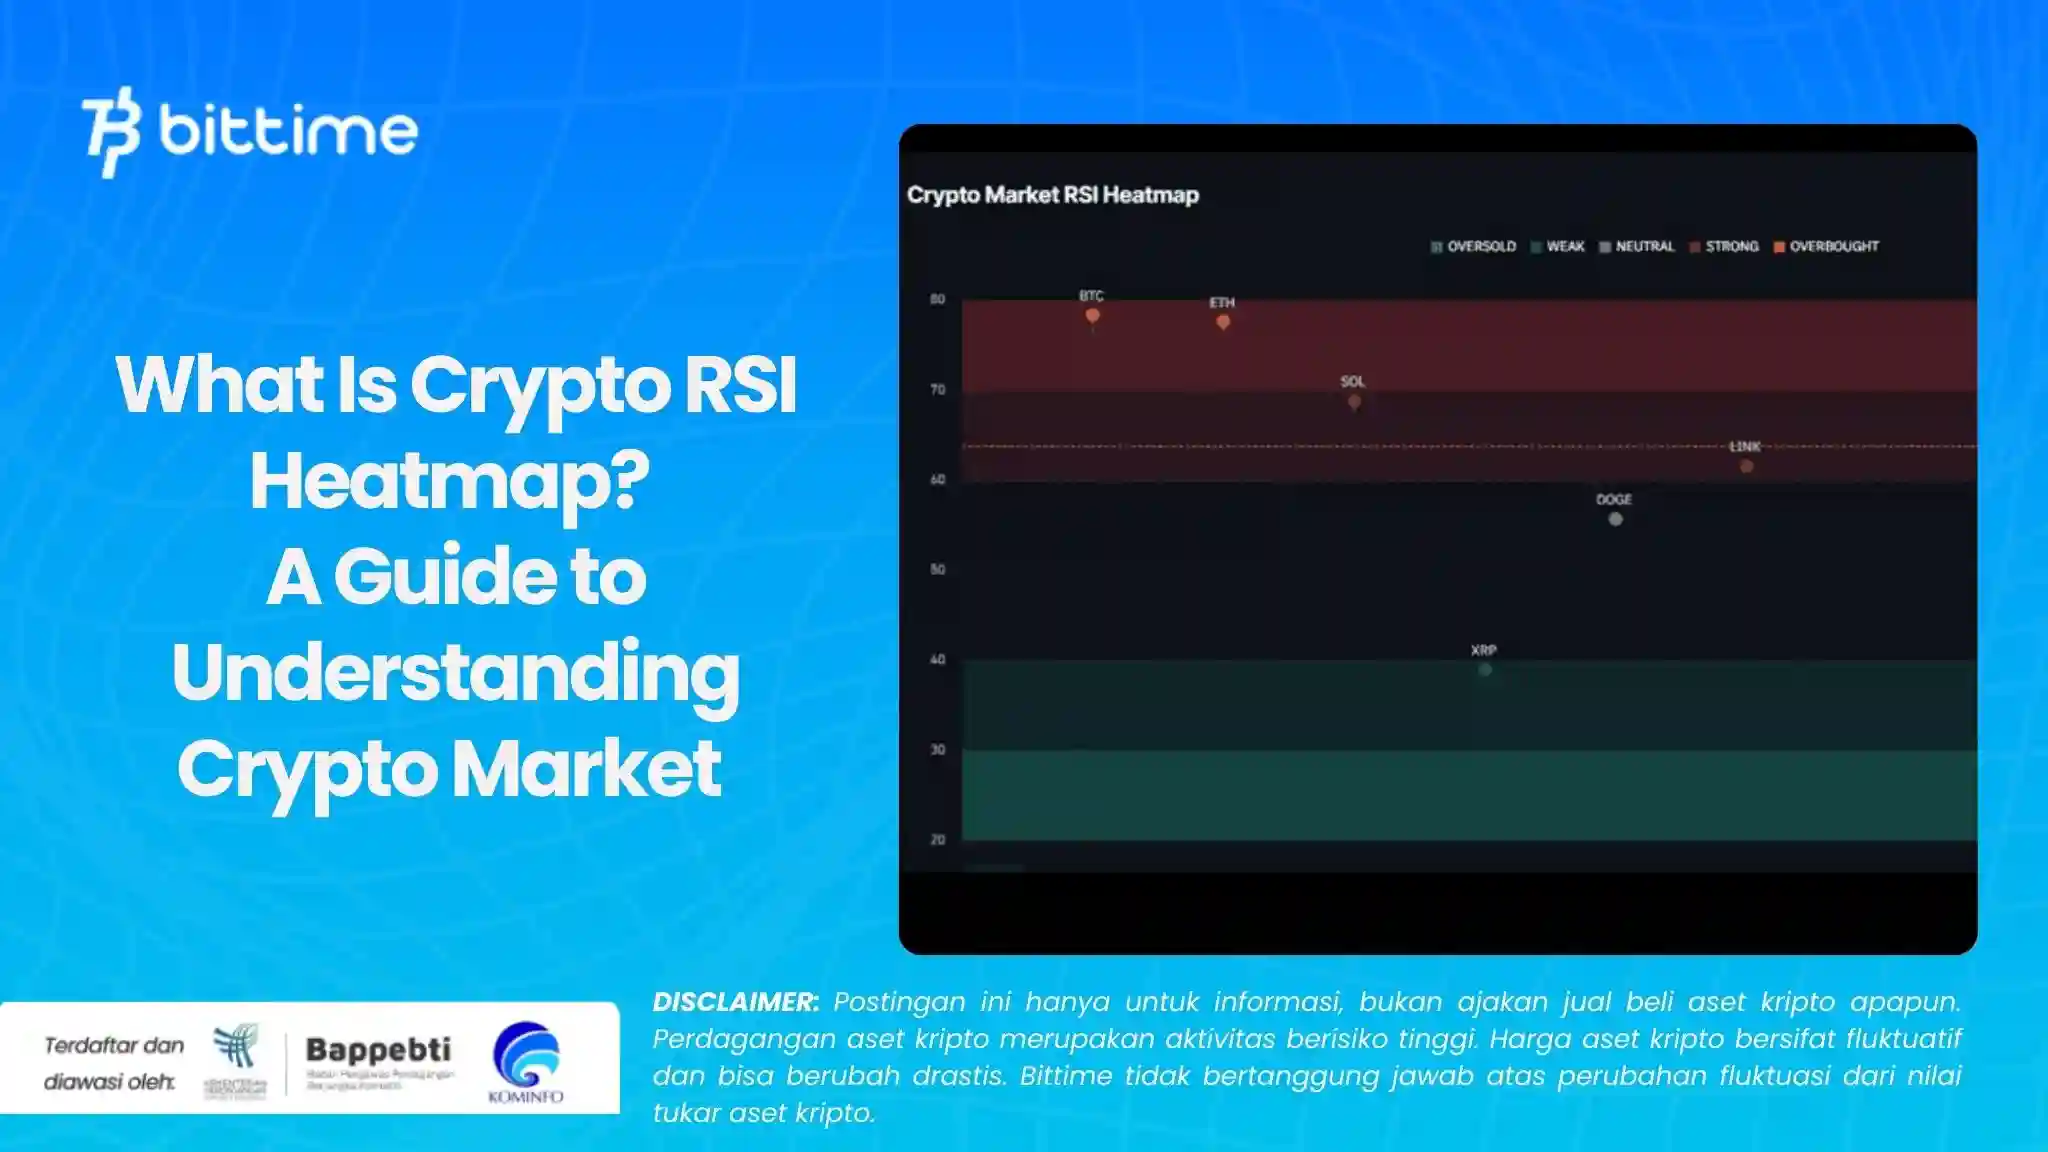
Bittime - What is crypto RSI heatmap? A guide to understanding crypto market conditions and overbought/oversold indicators. Crypto RSI Heatmap is a technical analysis tool that makes it easy for traders to monitor crypto market conditions quickly and efficiently.
This article will explain what RSI is and how RSI Heatmap helps traders understand price momentum, while also giving you guidance on using this tool for better trading strategies.
Also read: Frequent Losses When Trading Crypto? Here Are 7 Causes!
What is the Relative Strength Index (RSI)?
The Relative Strength Index (RSI) is a technical indicator used to measure the speed and change of price movements.
RSI helps traders determine whether an asset is in overbought or oversold conditions , which can be a signal for a possible price reversal.
How to Calculate RSI
RSI is calculated using the average closing price over a specified period (usually 14 days) with the following formula:
RSI=100−(1+RS100)
RS (Relative Strength) is the ratio between the average price increase during a certain period to the average price decrease during the same period.
RSI above 70
Indicates that the asset may be in an overbought condition and could potentially experience a correction.
RSI below 30
Indicates that the asset may be in oversold conditions and could potentially reverse upwards.
What is RSI Heatmap?
RSI Heatmap is a visual tool that displays RSI values for multiple assets at once. Using symbols and colors, this Heatmap helps traders identify trading opportunities at a glance, without having to check the RSI of each asset individually.
RSI Heatmap Key Features
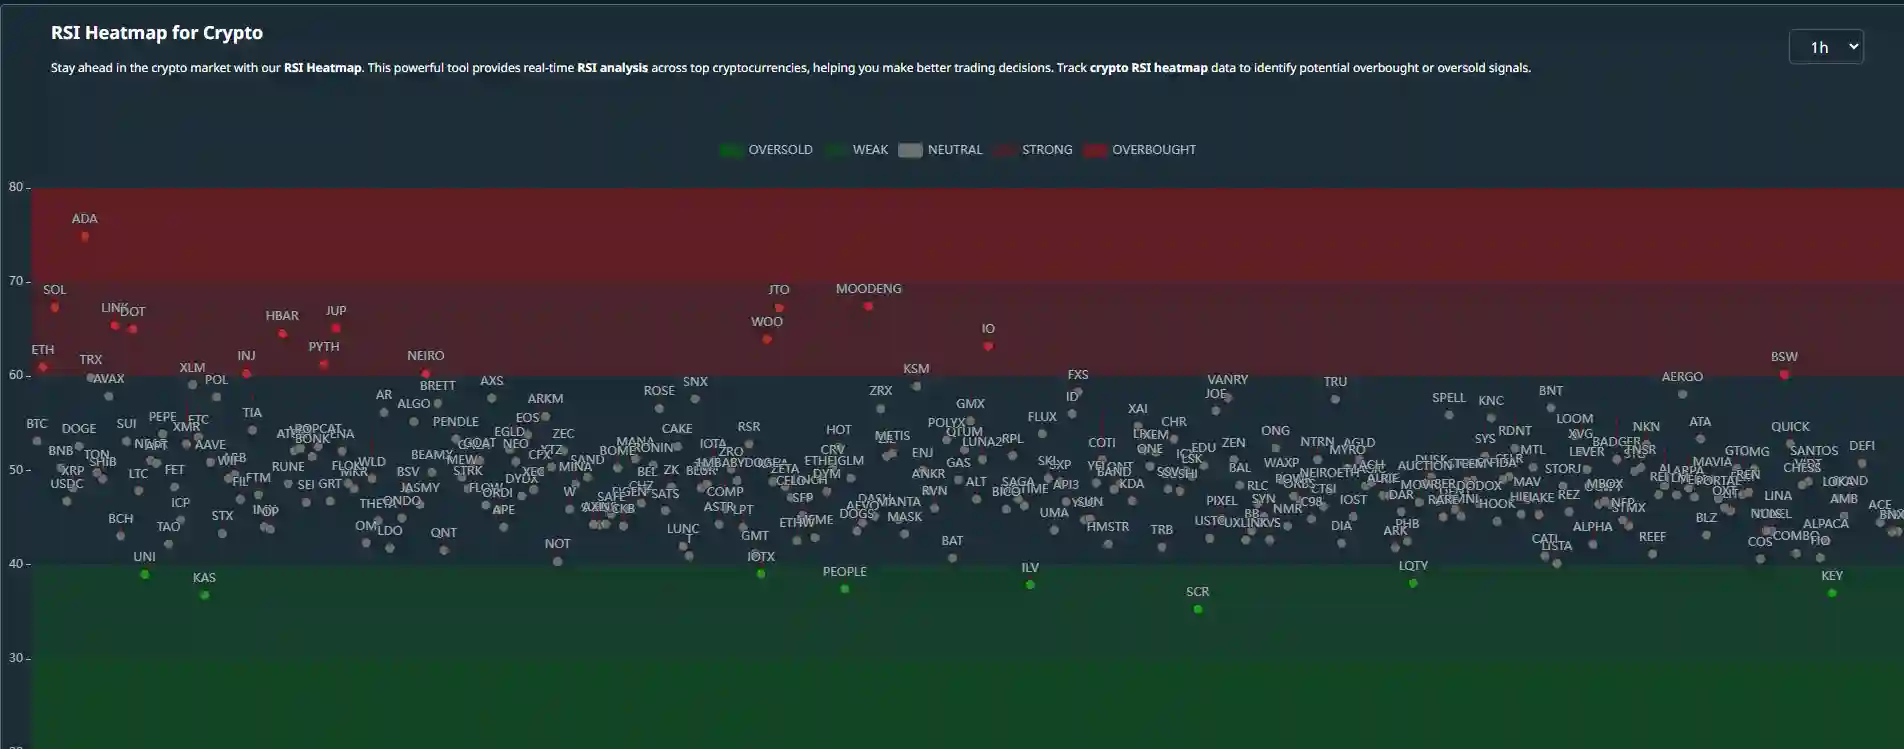
Source: *https://marketmasters.ai/rsiheatmap*
RSI Heatmap displays current and historical RSI values for over 280 symbols. Some of the important zones represented in this Heatmap include:
Weak Zone (40-30)
Indicates early signs of weakness, but not yet oversold.
Zone Oversold (30-20)
Indicates that the asset is heavily sold, with potential for a rebound.
Strong Zone (60-70)
Shows increasing strength, but has not yet reached overbought.
Zona Overbought (70-80)
Indicates that the asset is heavily bought, potentially experiencing a price correction.
Also read Candlestick Learning Guide for Crypto Trading for Beginners
How RSI Heatmap Helps Traders?
RSI Heatmap makes it easy for traders to:
1. View trading opportunities quickly
By displaying RSI conditions for multiple assets in one view, traders can easily identify which ones are approaching overbought or oversold levels.
2. Make better decisions
The information presented visually helps traders determine when to enter or exit the market based on the strength or weakness of price momentum.
Also read Doji Candlestick: Definition, Types, and How to Read It
RSI Zone Explanation Table
Conclusion
Using RSI and RSI Heatmap together can help traders make better trading decisions.
RSI provides signals about overbought or oversold conditions, while Heatmap presents RSI data visually for many assets, making it easier for traders to identify trading opportunities.
How to Buy Crypto on Bittime

Want to trade sell buy Bitcoins and crypto investment easily? Bittime is here to help! As an Indonesian crypto exchange officially registered with Bappebti, Bittime ensures every transaction is safe and fast.
Start with registration and identity verification, then make a minimum deposit of IDR 10,000. After that, you can immediately buy your favorite digital assets!
Check the exchange rate BTC to IDR, ETH to IDR, SOL to IDR and other crypto assets to find out today's crypto market trends in real-time on Bittime.
Keyword SEO Potensial:
, crypto market prediction, rsi trading strategy, crypto technical analysis, rsi heatmap indonesia, understanding price momentum
Disclaimer: The views expressed belong exclusively to the author and do not reflect the views of this platform. This platform and its affiliates disclaim any responsibility for the accuracy or suitability of the information provided. It is for informational purposes only and not intended as financial or investment advice.


