What is a Double Bottom Pattern and How to Trade it?
2024-08-10
Bittime – The double bottom pattern is one of the important graphic patterns in technical analysis of the stock market and other assets. This pattern depicts price movements that form a "W" pattern and indicates a potential trend reversal from down to up. Understanding these patterns can help investors make better trading decisions. This article will explain what the double bottom pattern is, how to read and trade it, and strategies that can be used.
Double Bottom Pattern Definition
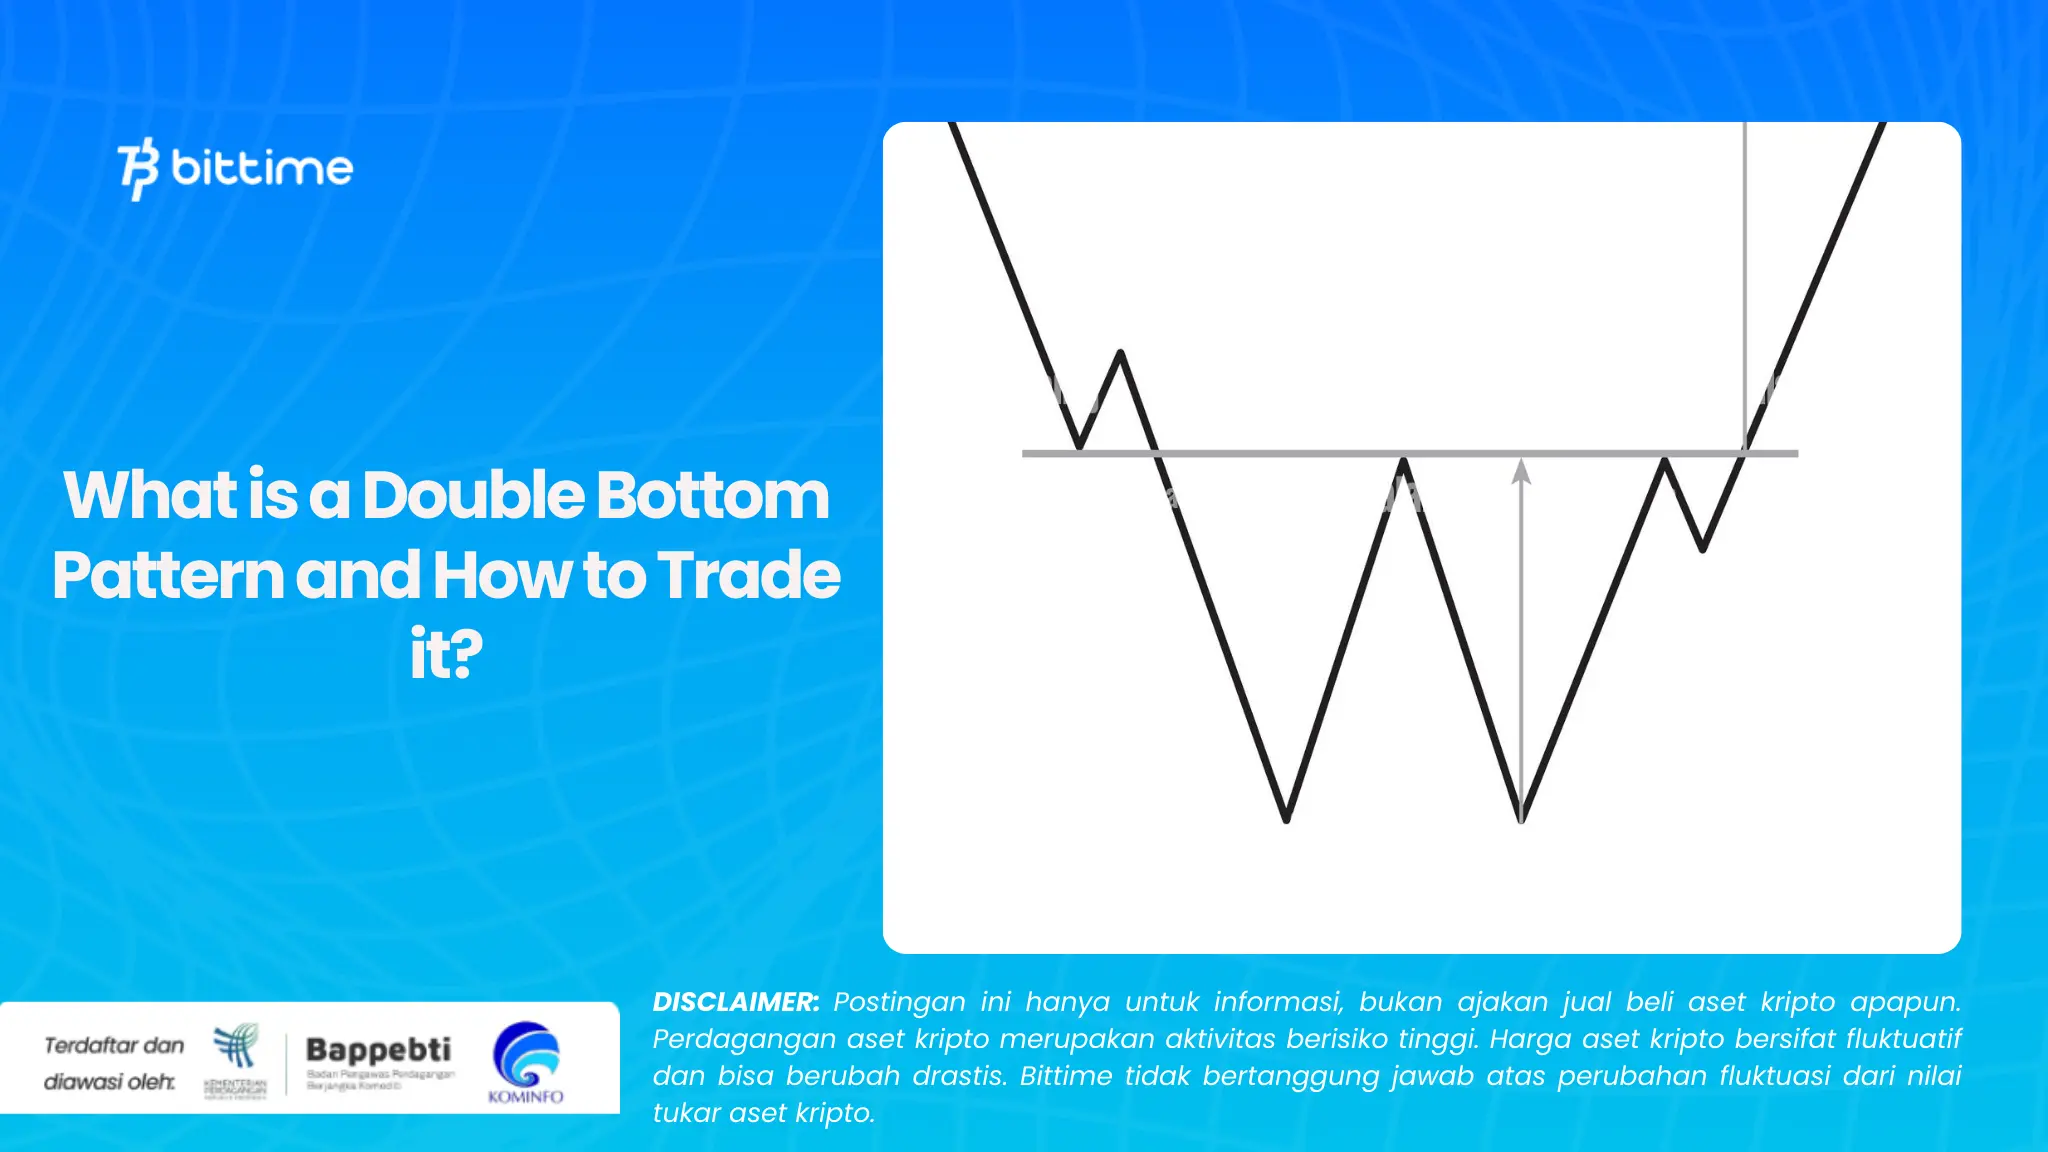
The double bottom pattern occurs when the asset price experiences two declines followed by an increase in prices. This pattern begins with a first decline in price, then a recovery occurs, followed by a second decline that is similar to the first decline, before finally the price rises significantly. This pattern resembles the letter "W", where the two lowest points (bottom) are connected by a horizontal line called the neckline.
How is the Double Bottom Pattern Formed?
First Drop: In this phase, the asset price experiences a sharp decline often caused by market panic or mass selling.
Recovery: After the first decline, the price begins to rise, but does not reach the previous high.
Second Drop: Prices fall again to nearly the same level as the first drop, often caused by investors looking to realize profits from purchases after the first drop.
Rise: After the second decline, the price begins to rise past the previous high, signaling the end of the double bottom pattern and a bullish signal.
The Importance of the Double Bottom Pattern
The double bottom pattern is a bullish indicator which indicates that after reaching two lows, asset prices tend to experience a significant increase. This indicates that the market has reached its lowest level and the potential for future price growth is quite high. Traders often use this pattern to predict trend reversals from bearish to bullish.
Differences with the Double Top Pattern
In contrast, the double top pattern is a chart pattern that indicates a trend reversal from bullish to bearish. This pattern is formed after the asset price reaches two peaks, followed by a significant price decline. In contrast to the double bottom pattern which indicates an opportunity for price increases, the double top pattern indicates the potential for a significant price decrease.
Trading Strategy When the Double Bottom Pattern is Formed
Aggressive Strategy:
Traders who choose an aggressive strategy will open a buy (long) position when the price reaches the second point of the double bottom pattern. They hope that this pattern will complete and the price will start to rise significantly.
Less Aggressive Strategy:
If a double bottom pattern has been formed, traders will choose to buy at the second point or slightly later. This strategy offers a smaller chance of profit compared to an aggressive strategy but with lower risk.
Conservative Strategy:
Traders who use a conservative strategy will wait for further confirmation before taking a buy position. They tend to wait until there are additional signals that a double bottom pattern is actually forming and the price will rise further.
Conclusion
The double bottom pattern is a useful tool in technical analysis to identify potential trend reversals from bearish to bullish. By understanding how these patterns form and how to trade them, investors can make more informed decisions. Whether using an aggressive, less aggressive, or conservative strategy, it is important to always monitor additional indicators and market confirmation before trading.
How to Buy Crypto on Bittime
You can buy and sell crypto assets easily and safely via Bittime. Bittime is one of the best crypto applications in Indonesia which is officially registered with Bappebti.
To be able to buy crypto assets on Bittime, make sure you have registered and completed identity verification. Apart from that, also ensure you have sufficient balance by depositing some funds into your wallet. For your information, the minimum purchase of assets on Bittime is IDR 10,000. After that, you can purchase crypto assets in the application. Study Complete Guide How to Buy Crypto on Bittime.
Monitor graphic movement of Bitcoin (BTC) price, Ethereum (ETH), Solana (SOL), and other cryptos to find out today's crypto market trends in real-time on Bittime.
Disclaimer: The views expressed belong exclusively to the author and do not reflect the views of this platform. This platform and its affiliates disclaim any responsibility for the accuracy or suitability of the information provided. It is for informational purposes only and not intended as financial or investment advice.


