Does Bitcoin Rainbow Chart Show a Big Rise in August?
2024-08-07
Bittime - The Rainbow Bitcoin chart shows an intense bull run for BTC over the next 12-18 months. Market sentiment is still lukewarm and the public's frenzy has not yet started, even though the price is just below the ATH.
The Rainbow Bitcoin chart is a fun and uncomplicated way for investors to get an idea of where BTC is in the cycle.
What is Rainbow Bitcoin?
The Rainbow Bitcoin Chart is an analysis tool developed in 2014 to provide a visual view of Bitcoin price movements. This chart uses logarithms to smooth out some of the intense volatility Bitcoin has experienced in the last decade. The different colored bands on the chart give investors a glimpse into market sentiment. However, keep in mind that this tool is more suitable for long-term holders than day traders.
Rainbow Bitcoin Projections for 2024
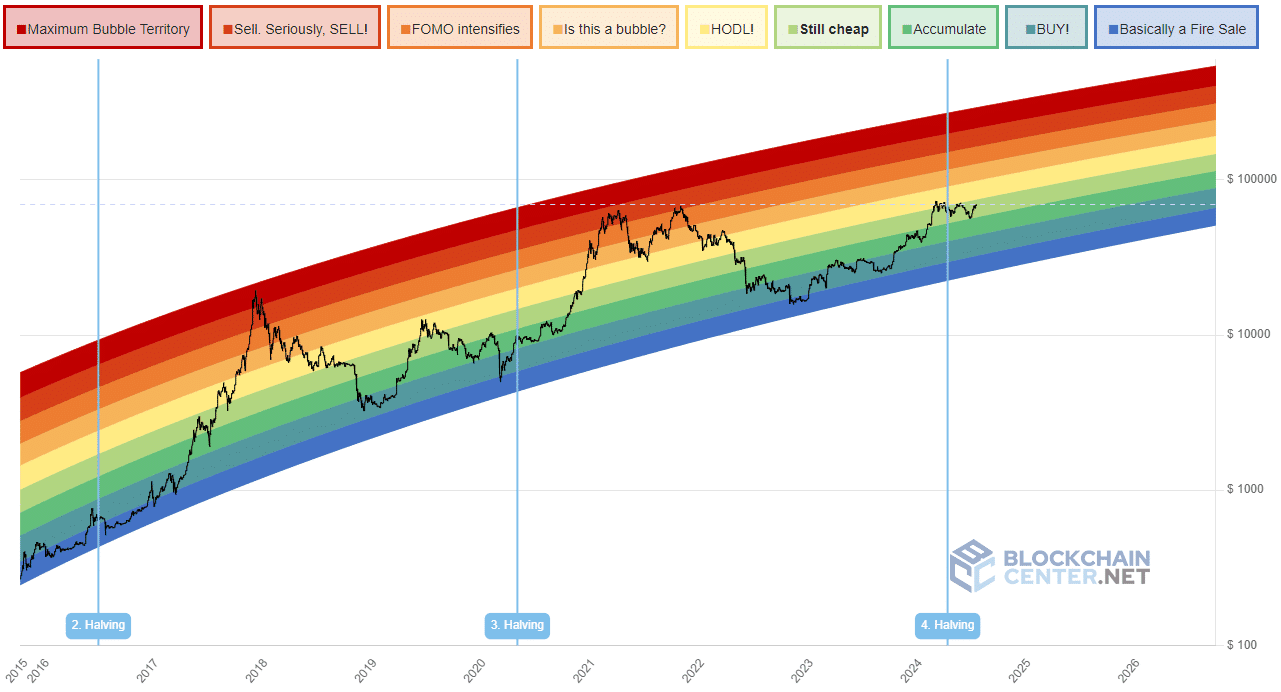
Bitcoin's rainbow chart provides a positive indication of BTC's future. By looking back at the last two halvings, we can see that prices took several months to recover after the halving event. This cycle is different from others so far, in that prices rose rapidly before the halving occurred, and reached an all-time high just a month later.
Even though prices have increased, they are currently still in the accumulation zone. This is very encouraging for shareholders and long-term investors. As some prominent crypto traders have pointed out, FUD events like Mt. Gox, the German government, or the sale of BTC confiscated by the US government are all in the past. Public sentiment is currently lukewarm, but price is very close to ATH. Things could heat up quickly and become more bullish in the coming year.
In the previous cycle, the cycle peak occurred 546 days after the halving. If history repeats itself, Bitcoin could reach the top of this cycle in October 2025. This could put the price in the $144k-$184k range, assuming the “sell, seriously, SELL” zone is not reached.
Insights from On-Chain Metrics
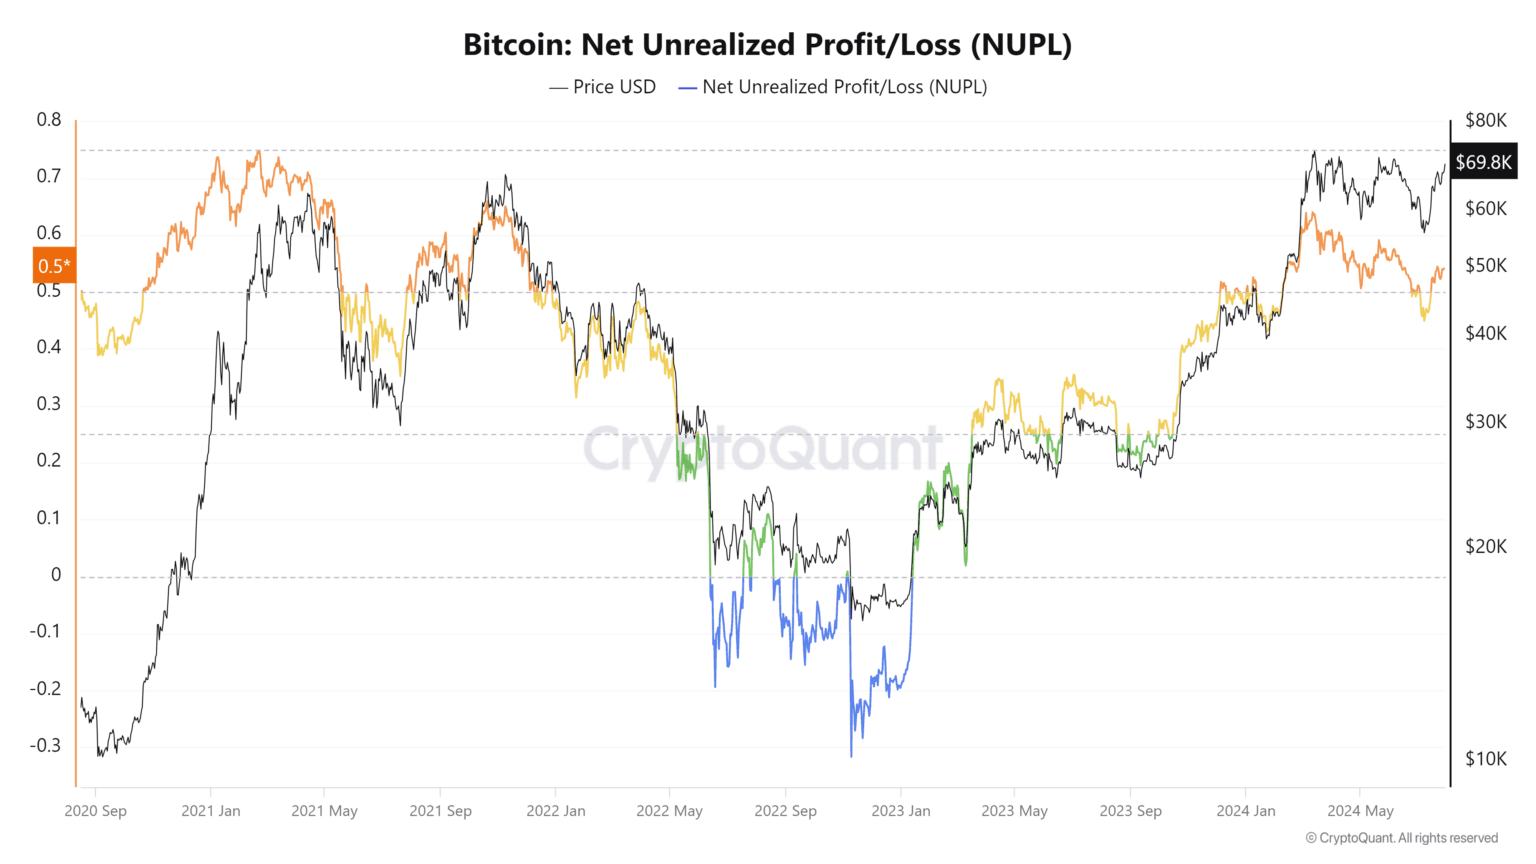
AMBCrypto looks at the Net Unrealized Profit/Loss (NUPL) metric. This metric shows the total amount of profit/loss across all coins, represented as a ratio. Values above 0.7 generally indicate a market top. In March 2024, the NUPL metric reached 0.62, representing overheated conditions and increasing selling pressure due to profit-taking. However, the trend has continued to decline since then. Therefore, there is more room for prices to rise.

Additionally, NUPL can remain above 0.5 for months. The second half of 2020 is a prominent example, and the same could be repeated in 2024. Overall, long-term investors can choose to accumulate more BTC or simply HODL. Sustained price increases are possible, but may take several more months.
How to Buy Crypto with Bittime

You can buy and sell crypto assets in an easy and safe way via Bittime. over is one of the best crypto applications in Indonesia which is officially registered with Bappebti.
To be able to buy crypto assets on Bittime, make sure you have registered and completed identity verification. Apart from that, also make sure that you have sufficient balance by depositing some funds into your wallet. For your information, the minimum purchase of assets on Bittime is IDR 10,000. After that, you can purchase crypto assets in the application.
Monitor graphic movement price Bitcoin (BTC), Ethereum (ETH), Solana (SOL) and other cryptos to find out today's crypto market trends in real-time on Bittime.
Disclaimer: The views expressed belong exclusively to the author and do not reflect the views of this platform. This platform and its affiliates disclaim any responsibility for the accuracy or suitability of the information provided. It is for informational purposes only and not intended as financial or investment advice.

.png)