Bitcoin Rainbow Chart: Understanding and How to Understand BTC Market Sentiment
2024-11-19
Bittime - For Bitcoin investors and traders, understanding the price movements of this digital asset can be a challenge. One way that is often done is to pay attention to the Bitcoin Rainbow Chart. What's that? Check out the explanation in this article.
The volatile and speculative crypto market often makes investors confused in making decisions. To help navigate the market, one tool that is quite popular among the Bitcoin community is the Bitcoin Rainbow Chart.
Since it was first introduced in 2014 by a forum user named "Trolololo," this chart has developed into a useful visual tool for depicting Bitcoin's long-term market sentiment. So, what is the Bitcoin Rainbow Chart? Stay tuned for the review!
What is a Bitcoin Rainbow Chart?

Source: blockchaincenter.net
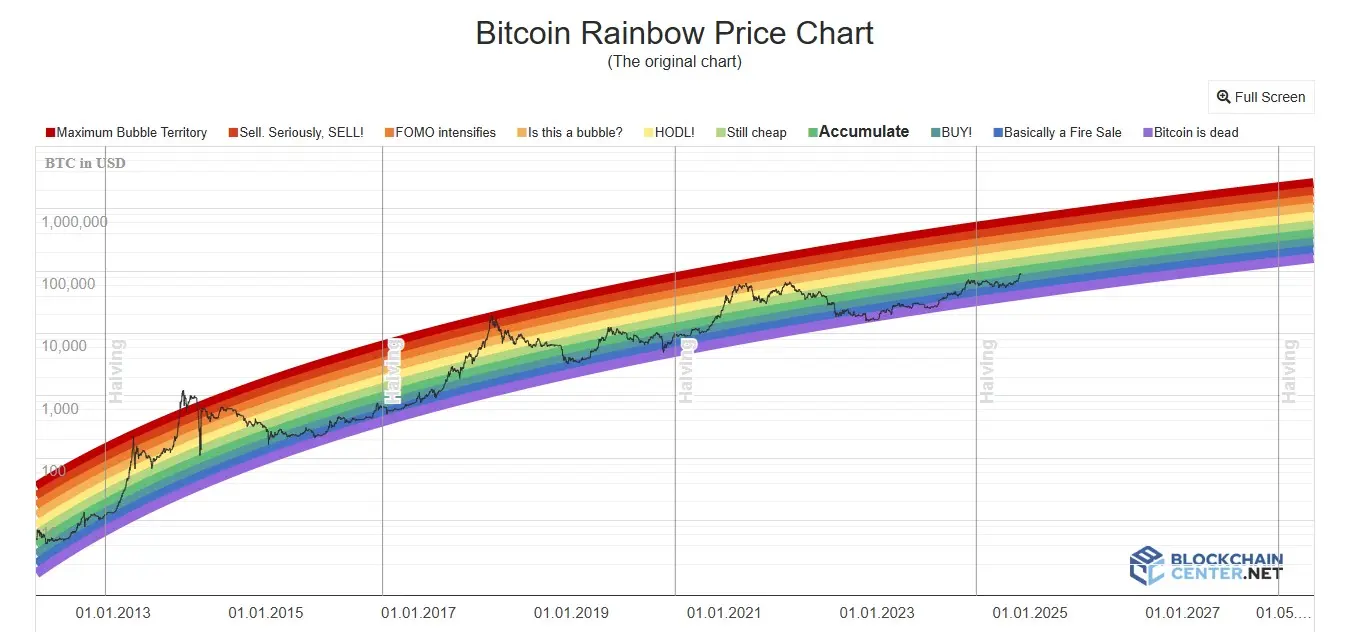
The Bitcoin Rainbow Chart is a colorful chart designed to provide an overview of the price of Bitcoin in various zones indicating potential future price movements.
The goal of this chart is to simplify Bitcoin market analysis by using easy-to-understand visuals.
Each color in this chart indicates a specific price zone, which gives an indication of whether Bitcoin is undervalued, overpriced, or right at a fair value.
Essentially, these charts help investors filter market noise and provide clues about ongoing market sentiment. For beginners who are not yet familiar with more complicated technical analysis, this chart is a very useful tool to get a general idea of what is happening with the price of Bitcoin.
Read also: Will MicroStrategy Stop Buying Bitcoin Someday?
Bitcoin Rainbow Chart Evolution

Source: Atomic Wallet
Since it was first introduced, the indicator has not stopped at its first design and function. Over time, this chart has undergone several updates to improve its accuracy. Some of the main stages of evolution of this chart include:
2014: The Bitcoin Rainbow Chart was first introduced by a forum user by the name of "Trolololo."
2015: Chart design and colors are updated based on user feedback.
2018: Improvements to price and time levels to increase accuracy.
2020: Further updates as Bitcoin price surges significantly.
2022: Minor improvements to adapt to major changes in the increasingly volatile Bitcoin market.
These changes reflect rapidly changing market dynamics and how the Bitcoin community is working together to develop better and more useful tools for traders.
Interpretation of Color Zones on Bitcoin Rainbow Chart
This Bitcoin movement indicator is divided into several color zones, each representing market sentiment at a certain time. Each color zone reflects the potential direction of Bitcoin price movement, either upward or downward.
This gives investors an indication of when it is a good time to buy or sell. The following is an explanation of the color zones in the Bitcoin Rainbow Chart:
- Dark Red Zone: This zone indicates that the price of Bitcoin is at a very high point, and it is very likely that the price will fall. Historically, a dark red zone usually precedes a price decline.
- Red zone: The price of Bitcoin is at a level that is considered too high or a bubble, where many investors start to take profits before the price falls.
- Yellow Zone: This zone indicates uncertainty. Investors are advised to wait until the market situation is clearer before making a decision.
- Green and Blue Zones: This is a zone where Bitcoin is considered undervalued or cheap, and is generally a good time to buy, in the hope that the price will rise in the long term.
By looking at these color changes, traders can get a general idea of how the Bitcoin market is reacting based on previous price movements. However, keep in mind that while these charts provide useful indications, they are not perfect tools and should be considered with caution.
Read also: Comparison of Bitcoin (BTC) vs Ethereum (ETH) that you must know
Effectiveness and Accuracy of Bitcoin Rainbow Chart
Although this indicator is not an analytical tool that can provide definite predictions, this chart has proven to be quite effective. Especially, in monitoring long-term Bitcoin price trends.
By following previous price movement patterns, this chart can help map possible future price movements, especially ahead of major events such as the Bitcoin halving, which occurs every four years.
For investors who focus on long-term investments, this chart functions like a GPS that guides the Bitcoin price journey over time. However, due to the high volatility of the crypto market, this chart is best used in conjunction with other indicators.
Among them are models like stock-to-flow or other technical analysis, to get a more complete picture and reduce the risk of prediction errors.
Practical Applications and Limitations of Bitcoin Rainbow Chart
While this Bitcoin indicator can provide useful insight into market sentiment, it should not be used as the sole indicator for making trading decisions.
To increase prediction accuracy, traders often combine the Bitcoin Rainbow Chart with other indicators such as:
Moving Averages (MA): To smooth out price fluctuations and identify clearer trends.
Relative Strength Index (RSI): To measure whether Bitcoin is overbought or oversold.
Bollinger Bands: To anticipate potential price fluctuations and profound changes in direction.
While the use of these indicators can provide a more complete picture of potential price movements, it is important to remember that the crypto market cannot be predicted with certainty.
Therefore, the Bitcoin Rainbow Chart is better used as a visual aid that makes it easier for traders to understand general market sentiment, not as a sole reference in making trading decisions.
Read also: Mining Bitcoin: How to Use Nicehash to Get Free BTC
Conclusion
The Bitcoin Rainbow Chart is a useful tool to help investors and traders understand Bitcoin market sentiment, especially over the long term. By providing an easy-to-understand visual depiction of Bitcoin price movements, this chart makes it easy for beginners to monitor market conditions.
However, although these charts provide useful insights, it is important to use other indicators. Apart from that, you need to do further research before making a trading decision.
As the Bitcoin market develops increasingly dynamically, this indicator will continue to adapt to market trends and become an increasingly sharp tool to help traders make smarter and more informed decisions.
How to Buy Crypto on Bittime

Want to trade sell buy Bitcoins and crypto investment easily? Bittime is here to help! As an Indonesian crypto exchange officially registered with Bappebti, Bittime ensures every transaction is safe and fast.
Start with registration and identity verification, then make a minimum deposit of IDR 10,000. After that, you can immediately buy your favorite digital assets!
Check the exchange rate BTC to IDR, ETH to IDR, SOL to IDR and other crypto assets to find out today's crypto market trends in real-time on Bittime.
Disclaimer: The views expressed belong exclusively to the author and do not reflect the views of this platform. This platform and its affiliates disclaim any responsibility for the accuracy or suitability of the information provided. It is for informational purposes only and not intended as financial or investment advice.


