Today's Crypto Heatmap Update: Visualization of Crypto Market Conditions
2025-02-03
Bittime - Crypto heatmap is a visual representation of crypto market conditions that depicts digital asset price movements in color.
With this crypto heatmap, traders and investors can understand market trends quickly without having to analyze complex numerical data. Read this article to find out today's crypto heatmap update!

Today's Crypto Heatmap Update
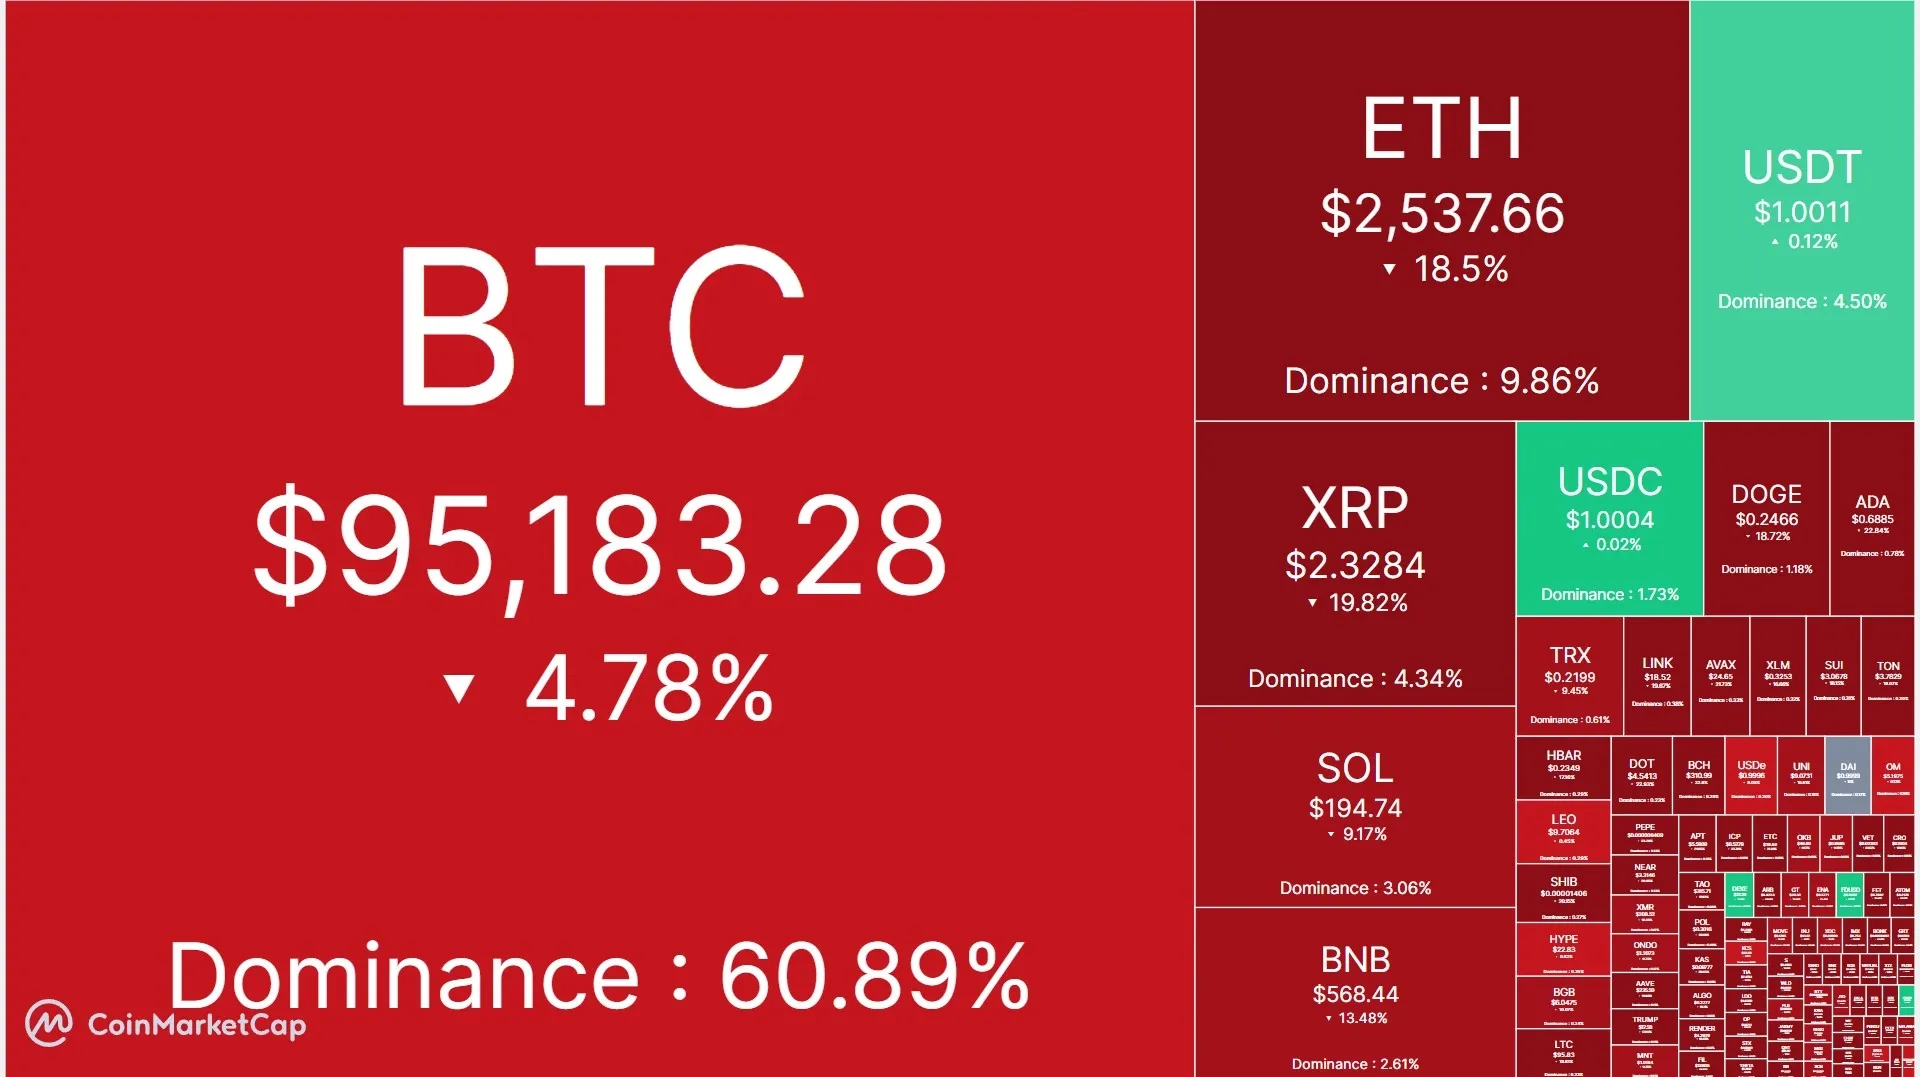
Sumber: Coinmarketcap
Based on the latest data, today's crypto heatmap update shows that the crypto market is experiencing a significant decline.
This is proven by the heatmap image which is dominated by red, which indicates a decrease in prices. Meanwhile, there are only 5 crypto assets that are colored green, which shows an increase in price.
Read Also: Bitcoin and Crypto Heatmap: Understanding and Everything You Need to Know
Crypto Heatmap: Today's Crypto Market Conditions
Based on the crypto heatmap above, Bitcoin (BTC), as the main crypto asset, experienced a decline of 4.78% at a price of $95,183.28, but Bitcoin's dominance in the market is still very strong, reaching 60.89%.
Besides that, Ethereum (ETH) also experienced a major correction with a drop of 18.5% and is trading at $2,537.66. XRP (XRP) also fell 19.82% to $2.3284, while Solana (SOL) plunged 9.17% to $194.74.
Meanwhile, stablecoins such as USDT and USDC remained stable at around $1,001, indicating that investors may be taking refuge in more stable assets amid market volatility.

Conclusion of Today's Crypto Heatmap
Today's crypto heatmap shows bearish market conditions with most assets experiencing price corrections, including several major assets.
Bitcoin is still the dominant asset, while ETH, XRP, SOL, and BNB are experiencing significant selling pressure. However, stablecoins remain stable amidst high volatility.
Crypto heatmaps can be a very useful tool in understanding market conditions quickly and efficiently. By understanding trends through heatmaps, you can take more appropriate investment steps.
Read Also: Getting to know Bitcoin Liquidation Heatmap: Definition and How it Works
Crypto Heatmap FAQs
What is Crypto Heatmap?
A Crypto Heatmap is a visual representation that shows the performance of various cryptocurrencies using color to indicate changes in price or trading volume over a certain period.
How to Read a Crypto Heatmap?
In Crypto Heatmap, each crypto asset is represented by a colored block. Warm colors such as red may indicate a decrease in price, while cool colors such as green indicate an increase. Block size can indicate the market capitalization or trading volume of an asset.
What are the Benefits of Using Crypto Heatmap?
Crypto Heatmap allows users to quickly identify market trends, best or worst performing assets, and understand overall market sentiment.
How to Buy Crypto with Bittime

Want to trade sell buy Bitcoins and crypto investment easily? Bittime is here to help! As an Indonesian crypto exchange officially registered with Bappebti, Bittime ensures every transaction is safe and fast.
Start with registration and identity verification, then make a minimum deposit of IDR 10,000. After that, you can immediately buy your favorite digital assets!
Check the exchange rate BTC to IDR, ETH to IDR, SOL to IDR and other crypto assets to find out today's crypto market trends in real-time on Bittime.
Additionally, visit Bittime Blog to get various interesting updates and educational information about the world of crypto. Find trusted articles about Web3, blockchain technology, and digital asset investment tips designed to enrich your knowledge in the world of crypto.
Reference
Coinmarketcap, Today's Crypto Heatmap, accessed February 4, 2025.
Author: IPR
Disclaimer: The views expressed belong exclusively to the author and do not reflect the views of this platform. This platform and its affiliates disclaim any responsibility for the accuracy or suitability of the information provided. It is for informational purposes only and not intended as financial or investment advice.

.png)