Beginners Candle Learning Guide for Crypto Trading
2024-09-09
Bittime - Crypto trading often involves technical analysis to determine the right time to buy and sell an asset. One of the main tools in technical analysis is the candlestick chart, which provides a visual representation of price movements over a certain period.
What is a Candlestick Chart?
Candlestick charts consist of "candles" that show the open, close, high, and low prices over a specified time period. Each candle has a body and wicks that show the price fluctuations over that period.
Menurut Investopedia, memahami pola-pola ini dapat membantu trader mengidentifikasi tren pasar dan potensi titik balik harga.
By learning basic candlestick patterns such as the hammer, engulfing, and doji, beginners can begin to develop a more informed trading strategy.
What are the Uses of Candlesticks?
CryptoCompare emphasizes the importance of studying candlestick patterns as they can provide insight into market sentiment. Bullish and bearish patterns formed on candlestick charts are often used to predict future price movements.
By practicing reading and interpreting these patterns, novice traders can improve their skills in making better trading decisions.
Combining candlestick analysis with other technical analysis tools such as volume indicators and moving averages can help beginners get a more complete picture of market conditions.
What Do Candlesticks Represent?
Candlestick charts depict cryptocurrency price movements with “candles” representing specific time periods.
Each candle consists of a body and two shadows or “wicks” that show the highest and lowest prices within the period.
The candle body shows the opening and closing prices, while the color of the candle (green or red) indicates whether the price rose or fell during that period.
Candlestick Chart Analysis
To effectively analyze the cryptocurrency market, it is important to understand what each candle represents. The color of the candle body indicates whether the market is bullish (green) or bearish (red). Additionally, the length of the wick provides insight into the volatility and market sentiment during the trading session.
Candlestick patterns can also be grouped into bullish or bearish formations, which help traders predict possible market reversals or continuations.
Bullish Pattern
Hammer Pattern
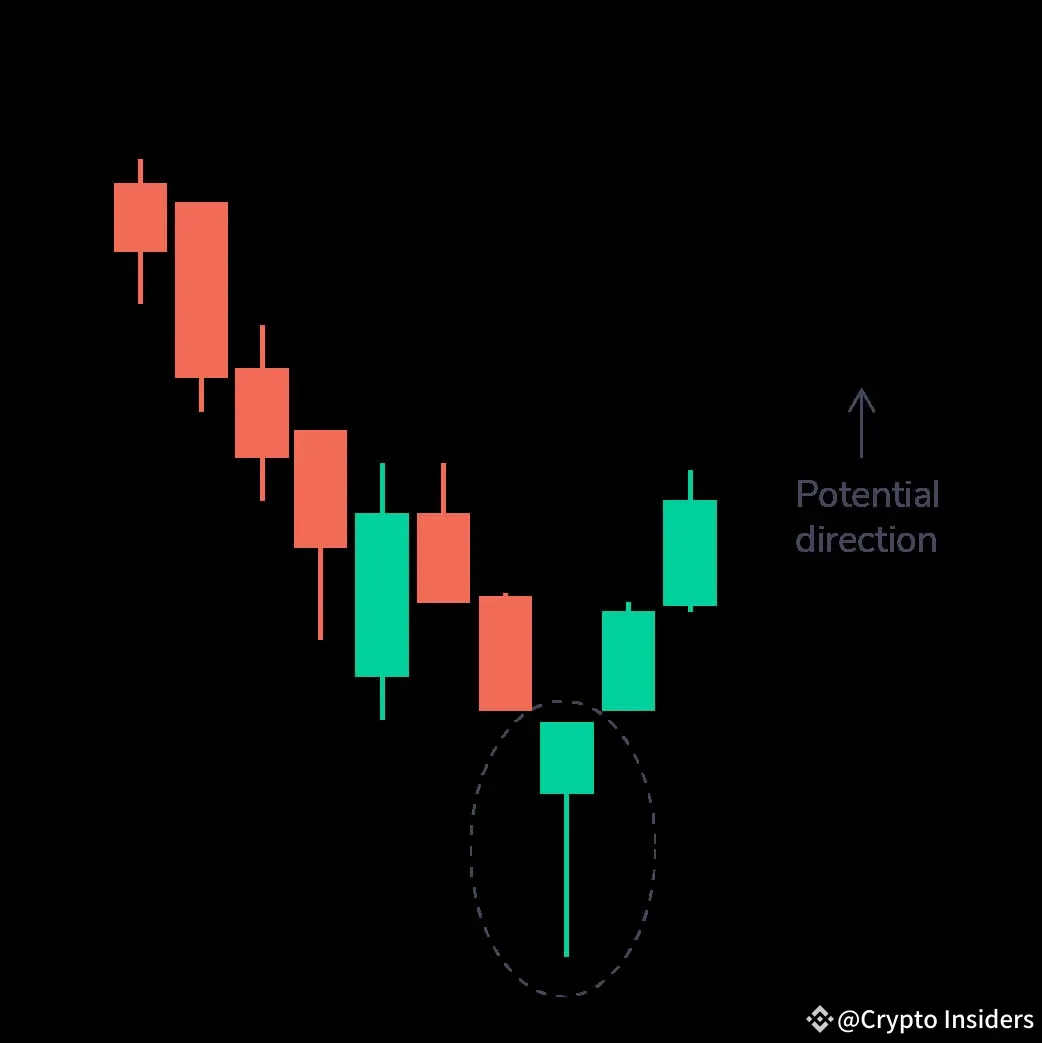
Shows a small body with a long lower wick, appearing at the end of a downtrend. It indicates that buyers stepped in, preventing further price declines.
Inverse Hammer
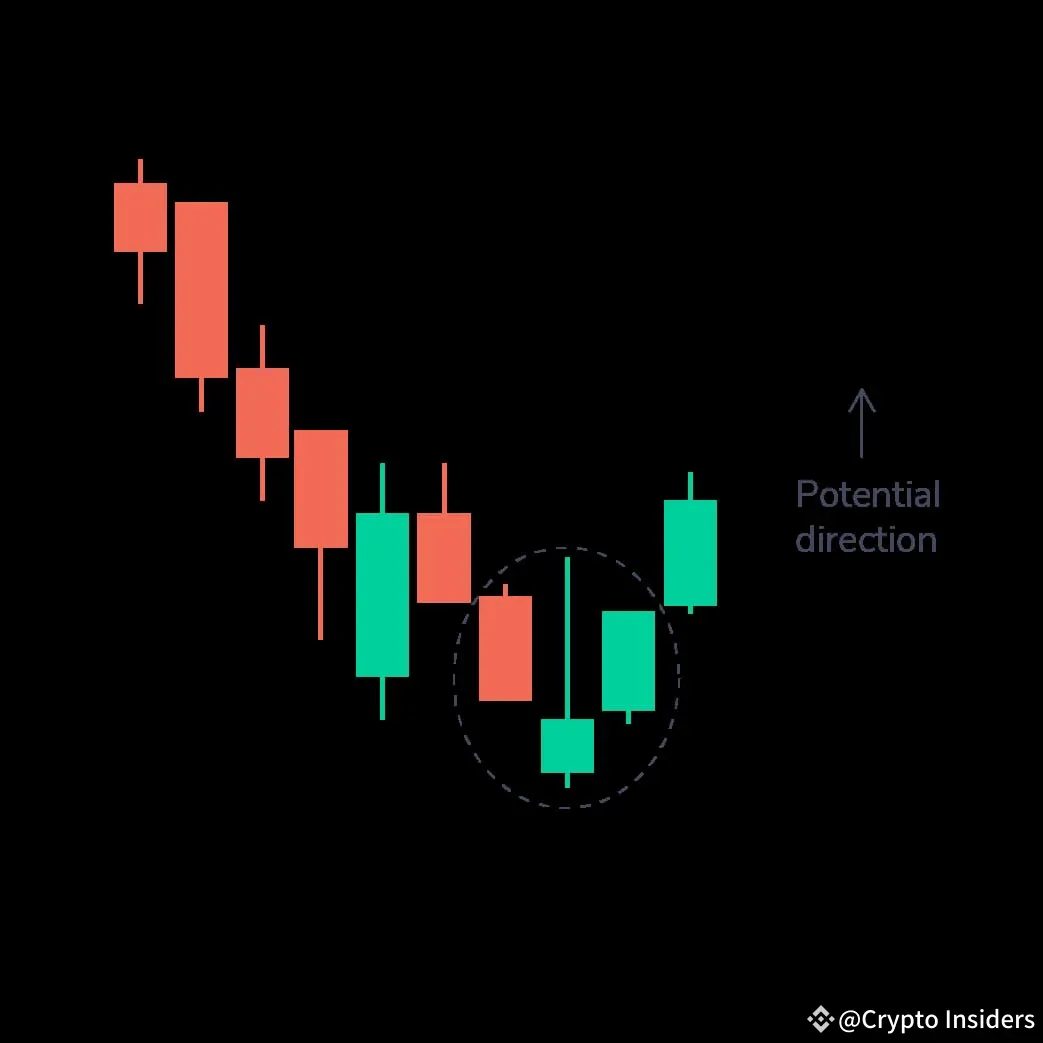
Similar to the hammer, but with a long upper wick. It shows buying pressure after an initial decline.
Bullish Engulfing
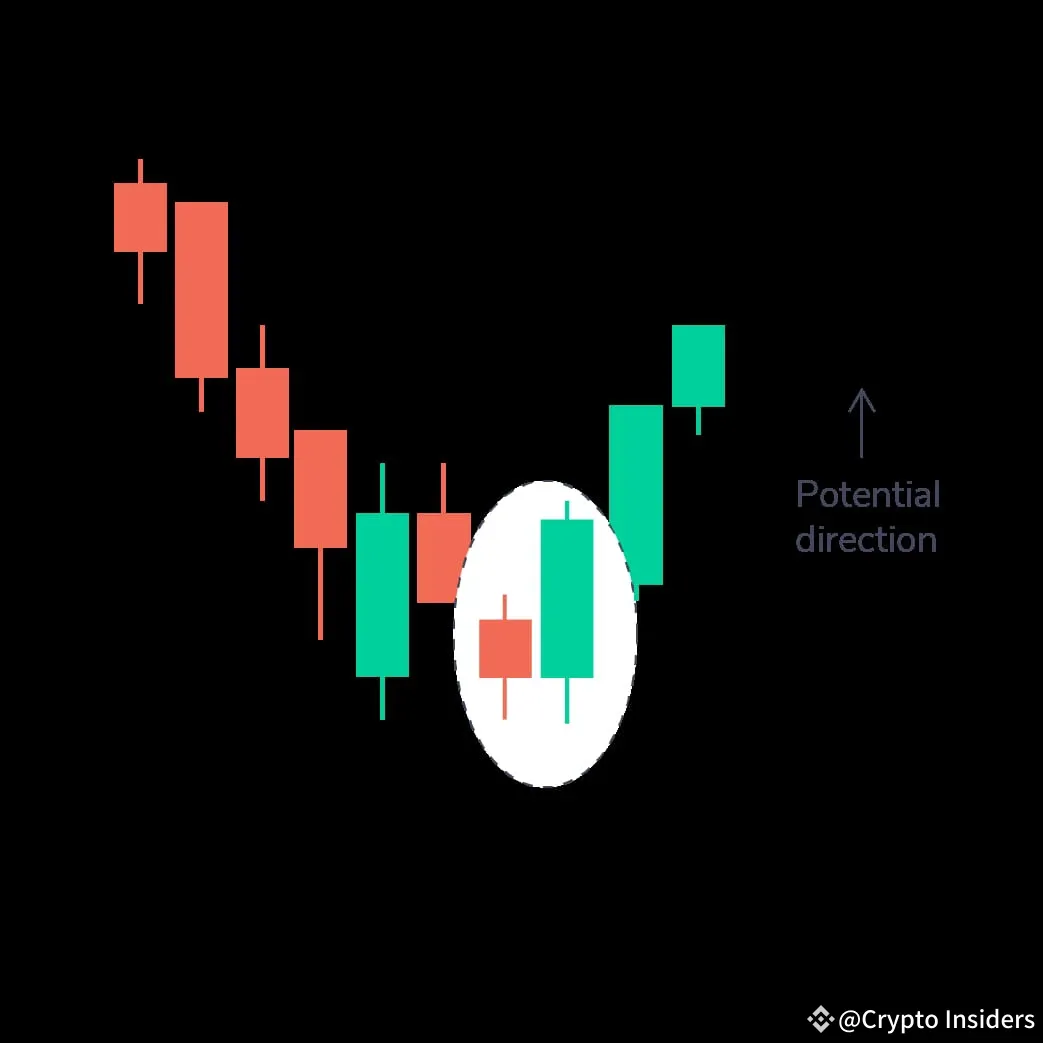
A small red candle followed by a large green candle, indicating a bullish trend despite a weak start.
Piercing Line
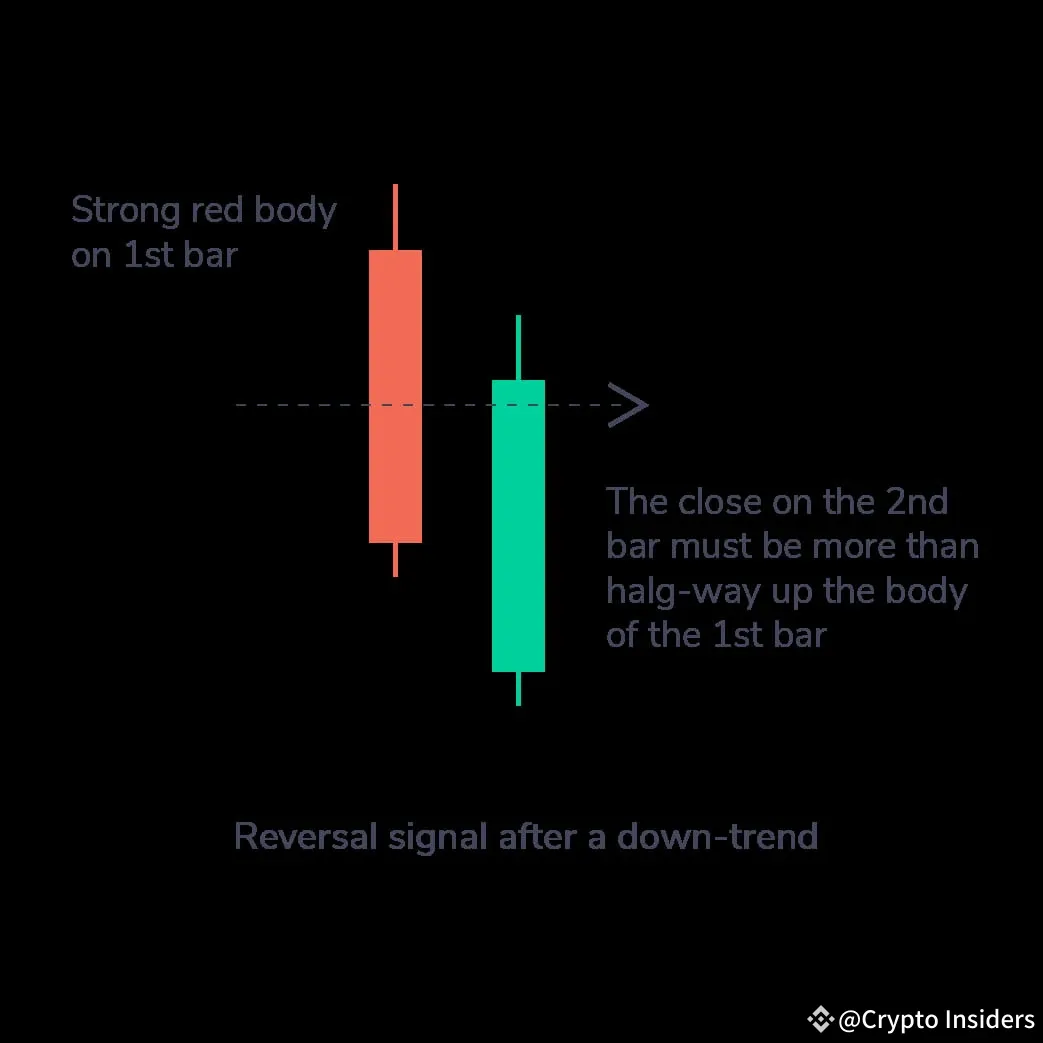
A long red candle followed by a green candle that closes above the midpoint of the previous red body, indicating strong buying activity.
Morning Star
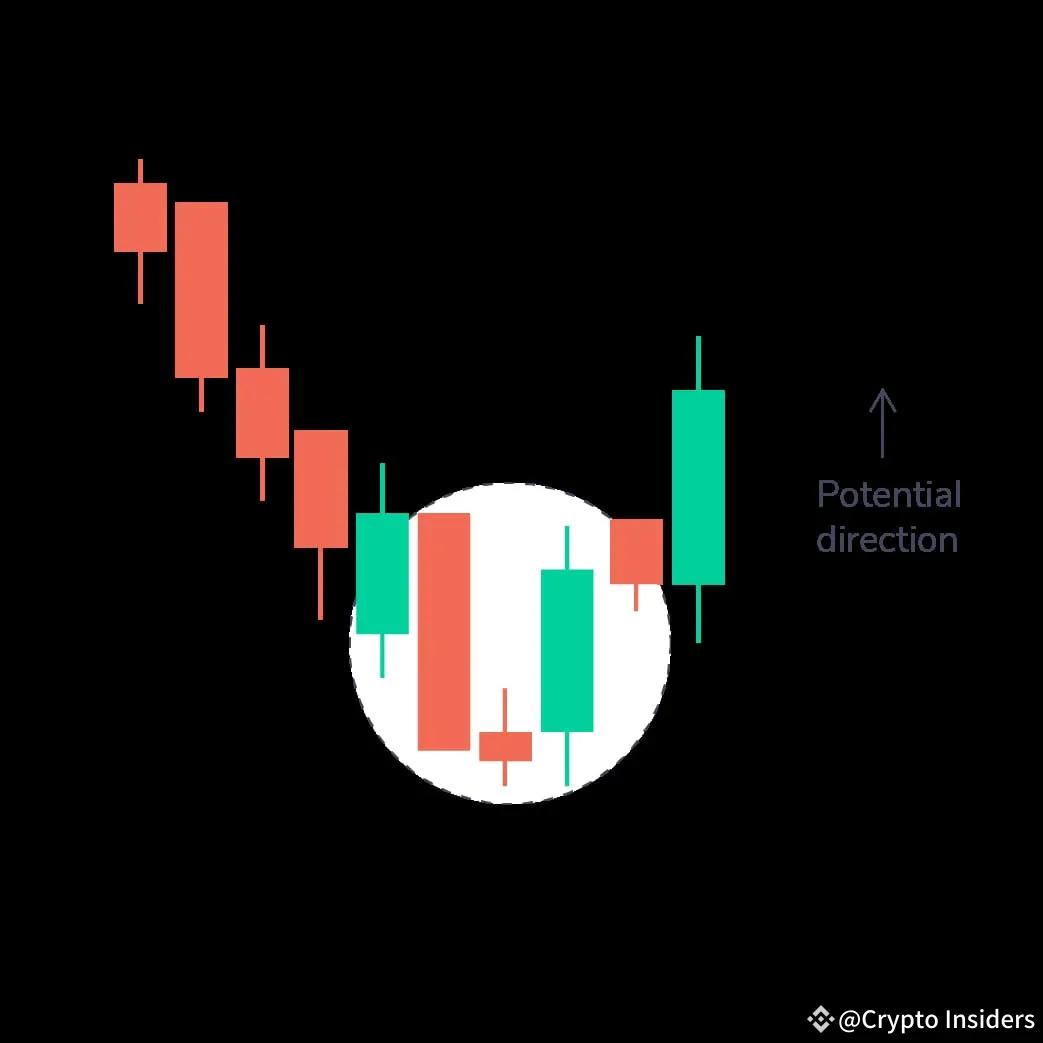
A three-candle pattern where a small-bodied candle appears between a long red candle and a long green candle. This indicates that selling pressure is weakening, and a bull market is coming.
Three White Soldiers
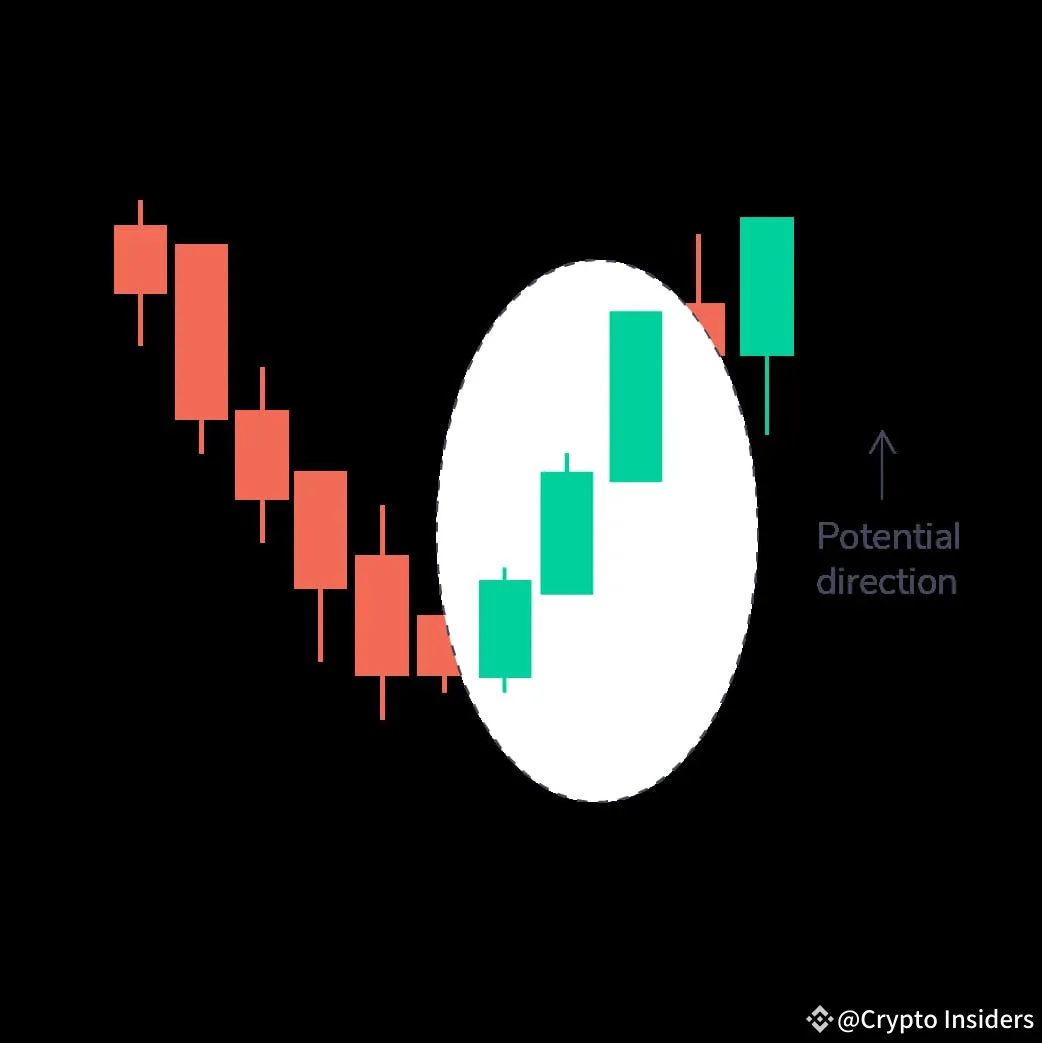
After a downtrend, three consecutive green candles with small wicks indicate a strong upward movement.
Bearish Pattern
Bearish Engulfing
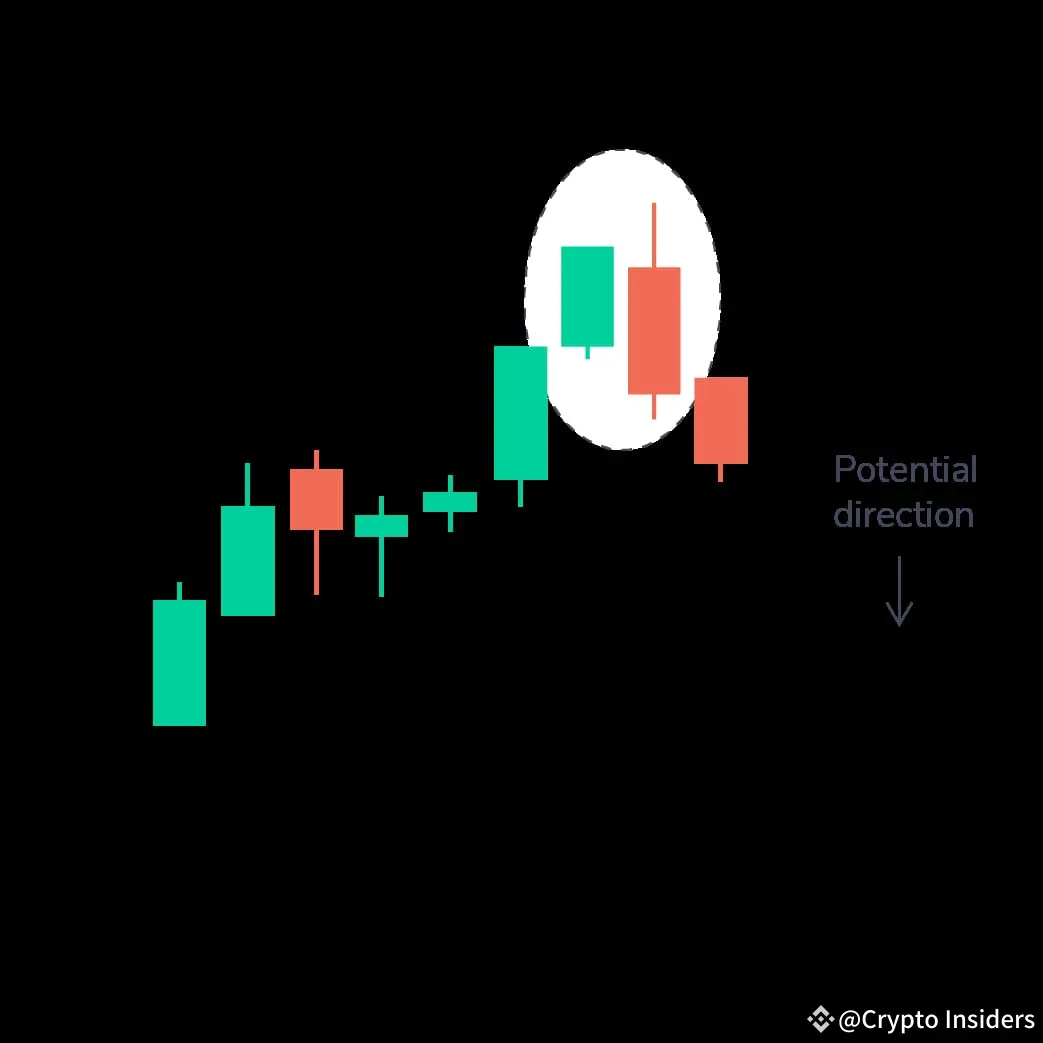
The opposite of the bullish engulfing, this pattern features a small green candle followed by a large red candle, often signaling the start of a downtrend.
Evening Star
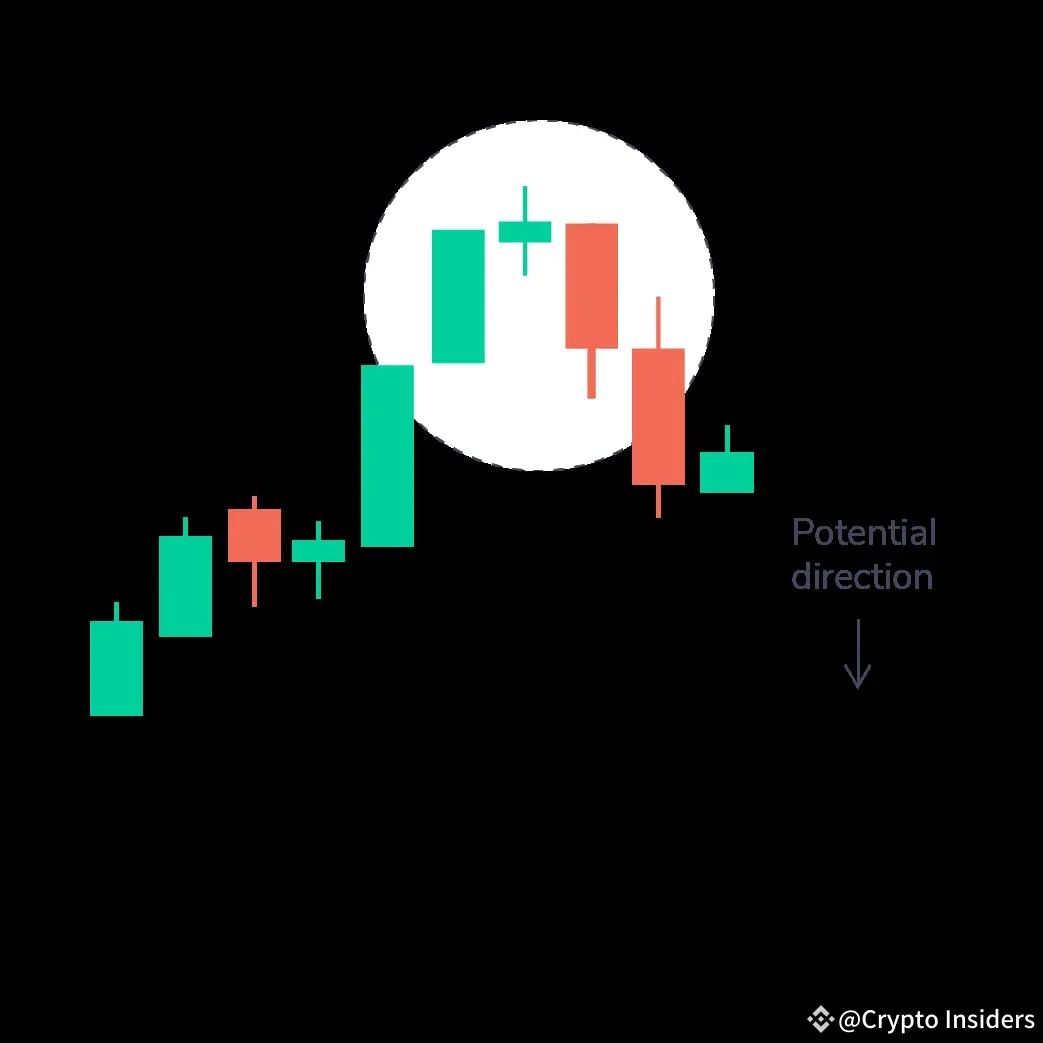
Similar to the morning star, but signals a reversal of an uptrend. A small-bodied candle appears between a long green candle and a long red candle, indicating that bullish momentum is slowing down.
Three Black Crows
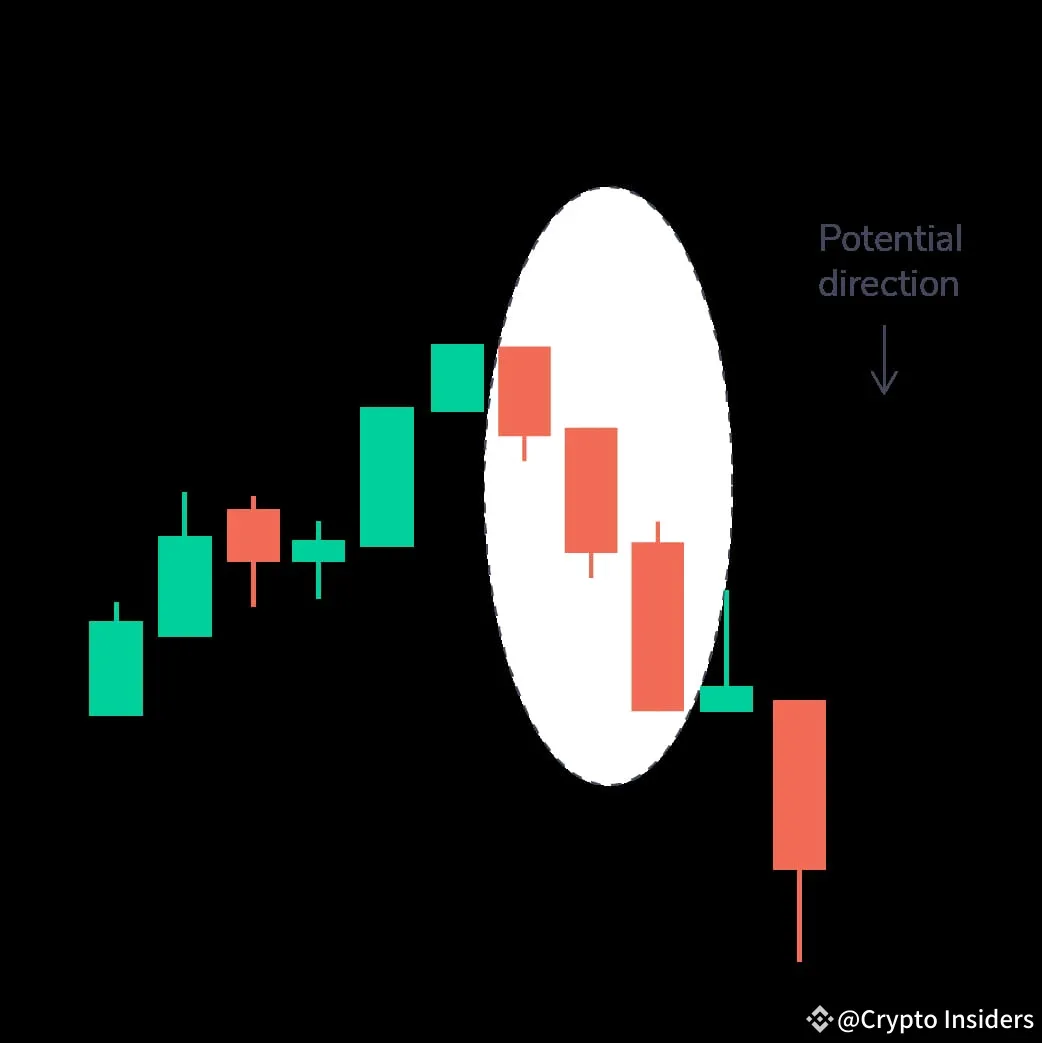
Three consecutive red candles with short wicks indicate a strong bearish reversal after an uptrend.
Conclusion: Candlestick is One of the Good Market Indicators
These patterns, although powerful indicators, should be used in conjunction with other market analysis tools.
Continuing to learn and refine your approach will improve your ability to navigate the complex cryptocurrency market.
As with any investment strategy, understanding risk and managing it effectively is key to long-term success.
How to Buy Crypto on Bittime
You can buy and sell crypto assets in an easy and safe way via Bittime. Bittime is one of the best crypto applications in Indonesia which is officially registered with Bappebti.
To be able to buy crypto assets on Bittime, make sure you have registered and completed identity verification. Apart from that, also make sure that you have sufficient balance by depositing some funds into your wallet. For your information, the minimum purchase of assets on Bittime is IDR 10,000. After that, you can purchase crypto assets in the application.
Learn How to Buy Crypto on Bittime.
Monitor price chart movements of Bitcoin (BTC), Ethereum (ETH), Solana (SOL) and other cryptos to find out today's crypto market trends in real-time on Bittime.
Disclaimer: The views expressed belong exclusively to the author and do not reflect the views of this platform. This platform and its affiliates disclaim any responsibility for the accuracy or suitability of the information provided. It is for informational purposes only and not intended as financial or investment advice.


