Kaspa (KAS) Price Prediction: Crypto Analyst Has Potential for Price Spike
2024-11-13
Bittime - Kaspa (KAS) price prediction according to Jeff Sekinger is a potential price spike. Kaspa (KAS) has been in the spotlight in the crypto community as it is predicted to experience a large price spike.
Also read Latest Bitcoin Price Prediction, End of 2024: BTC at What Price?
Jeff Sekinger's Analysis of Kaspa (KAS) Price
Prominent analyst Jeff Sekinger, in a post on the X platform (formerly Twitter), mentioned the potential for KAS to achieve a triple-digit price increase, similar to what happened in November last year.
This prediction has traders optimistic of a significant upward trend.

Kaspa Chart Analysis: Strong Support Zone
The KAS chart shows a strong support zone between the price of $0.10 and $0.11 (around Rp1,570 to Rp1,727), where the Kaspa price has risen several times after reaching this level.
This area serves as a strong foundation, provoking buying interest and restraining the price from further declines.
Also read AAVE Coin Prediction, Can Go to What Price?
After touching this support zone, the price of KAS recorded a 9.08% increase in a day, reaching a level of around $0.122 (around Rp1,915).
The consistent rise from this area indicates a bullish sentiment among investors, who continue to accumulate KAS at this price.
On the other hand, the resistance level between $0.18 to $0.20 (around Rp2,826 to Rp3,140) is a potential target if KAS prices manage to break out of the current consolidation pattern.
This resistance level will be very important to gauge the strength and sustainability of the KAS price increase going forward.
Downtrend Breakout: Signal of Change in Market Sentiment
In addition to strong support, Kaspa's price recently broke out of a downtrend line, indicating a shift in market sentiment.
Previously, this trend line connected lower price peaks, reflecting a bearish condition that is now starting to weaken.
Also read Optimism Coin (OP) Price is Predicted to Rise, Check out the Analysis!
This trend line breakout is an indication of a possible trend change, with further upside potential.
If KAS is able to maintain this upward momentum, there will likely be a large rally that matches Sekinger's prediction of the opportunity for a triple-digit price increase.
Relative Strength Index (RSI) Indicates KAS Momentum Shift
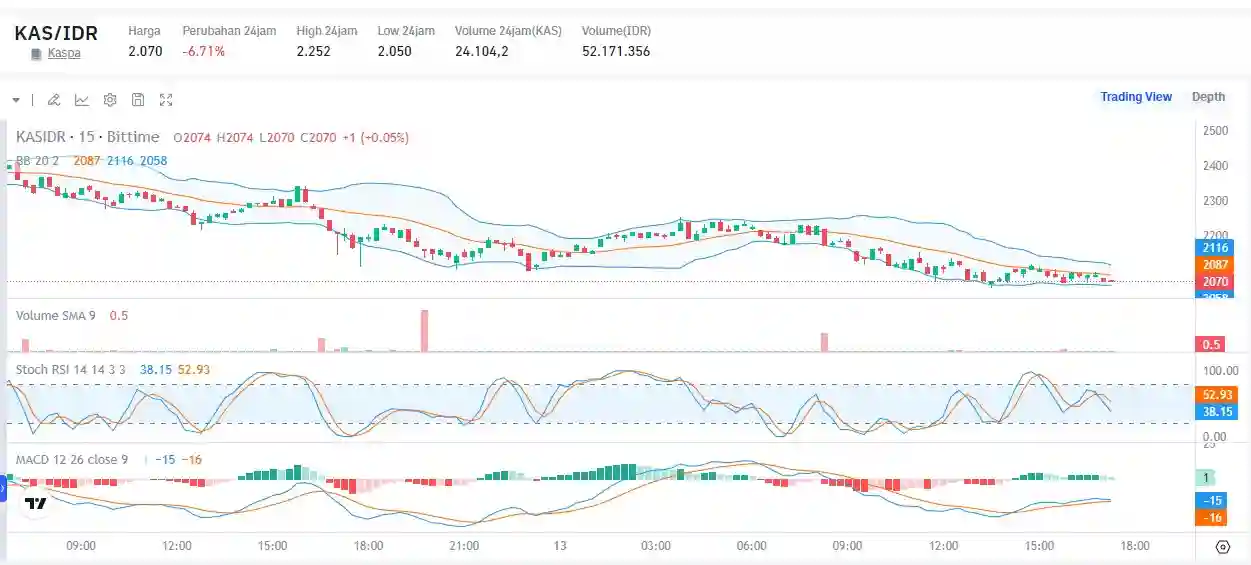
The Relative Strength Index (RSI) indicator also reinforces the positive outlook on KAS prices. Currently, the RSI is slightly above the centerline, indicating a positive shift in momentum without reaching overbought levels.
Historically, KAS often bottoms out when the RSI is in the 40-45 range, which is in line with the current position. This indicator suggests that KAS may be preparing for further upside, especially if buying interest continues to increase.
Seasonal Patterns in Kaspa Price Movement
Jeff Sekinger in his post also highlighted the existence of certain seasonal or cyclical patterns in the price movement of KAS, noting that November last year KAS experienced a significant triple-digit increase.
This historical pattern may influence the expectations of traders, who may see November as a potentially profitable period for KAS.
Sekinger's comment that “the bounce has just started” supports this view, suggesting the possibility of a continued uptrend.
Latest Kaspa (KAS) Price Today

How to Buy Crypto on Bittime

Want to trade sell buy Bitcoins and crypto investment easily? Bittime is here to help! As an Indonesian crypto exchange officially registered with Bappebti, Bittime ensures every transaction is safe and fast.
Start with registration and identity verification, then make a minimum deposit of IDR 10,000. After that, you can immediately buy your favorite digital assets!
Check the exchange rate BTC to IDR, ETH to IDR, SOL to IDR and other crypto assets to find out today's crypto market trends in real-time on Bittime.
Disclaimer: The views expressed belong exclusively to the author and do not reflect the views of this platform. This platform and its affiliates disclaim any responsibility for the accuracy or suitability of the information provided. It is for informational purposes only and not intended as financial or investment advice.


